


Puzzle: African American Proficiency Much Lower Than Kindergarten Readiness
In elementary school, something seems to work very differently for African American students than for other student groups. That’s the pattern that emerges from comparing KPREP proficiency rates for the last two classes of third graders to the kindergarten readiness rates when those classes started school. For Kentucky’s African American students:
- 44.2% were kindergarten ready starting the 2013-14 school year
- 32.8% were proficient in grade 3 reading in 2016-17, 11.4 points lower
- 30.3% were proficient in grade 3 math that year, 13.9 points lower
And the next year showed similar patterns:
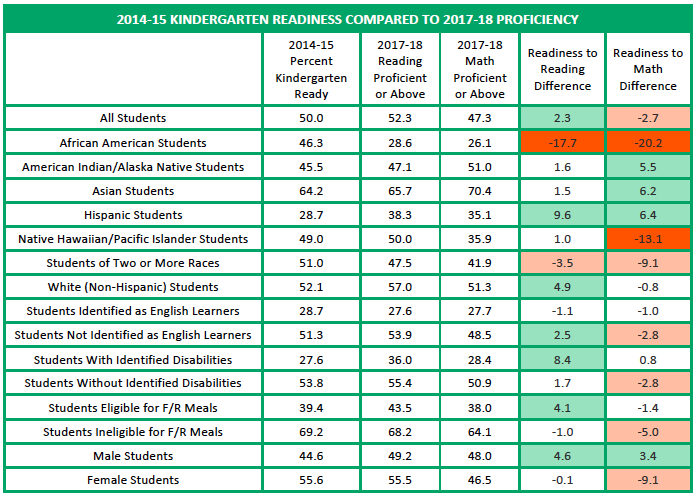
- 46.3% were kindergarten starting the 2014-15 school year
- 28.6% were proficient in grade 3 reading in 2017-18, 17.7 points lower
- 26.1% were proficient in grade 3 math that year, 20.1 points lower
That’s four proficiency results more than 10 points lower than readiness.There were only two results with proficiency that far below readiness for other groups, looking across both years, both subjects, and all student groups by race and linguistic group, gender, disability status, English learner status, and eligibility for free and reduced –price meals. The tables at the end of this post show the full set of results.The gap between African American and white students moved from below 8 points entering kindergarten to above 24 points in third grade. Again, that was the pattern four times (both years, both subjects). Again, no other pair of groups had gap changes with that scale and consistency. That analysis and other details are available for download in this brief report.This is a startling pattern, and it leads me to four main thoughts.First, there could be a problem with the data. That possibility deserves study, with the caution that any explanation will have to be one leading to African American patterns different from every other group.Second, if the results are credible, it may signal that something important in our elementary schools works very differently for these learners. For example, the difference may be in how African American students are taught or in what they are taught or in how they are treated. The difference may also be in schools’ cultural competency and capacity to build on the strengths African American students bring to school. (Equity, after all, is about delivering what works for each participant, rather than about doing identical things that yield differing results for those involved.) Education research has already shown clearly that these kinds of school-related factors can be in play, so the KSCREEN to KPREP comparisons may serve mainly to sharpen our sense of their impact and the years when they make the biggest difference.Third, some readers might want to explore how the pattern have its roots in things that happen outside our schools for African American students during their early elementary years. Any such claims should be specific about what other parts of those students’ lives change in these particular years. Frankly, that avenue of exploration seems far less promising than checking on the data issues and looking hard at factors within our schools.Fourth and finally, Kentuckians need to study, explore, and discuss these startling and disruptive patterns, first to understand them and second to deepen our efforts to develop the full potential of Kentucky’s African American students. This is a puzzle we need to solve.