

2020 School Reports Cards: Thoughts from a Quick Tour
2020 Kentucky School Report Cards, released on Wednesday, offer important ways to learn about your local schools. Here’s a quick look at some of what’s there.
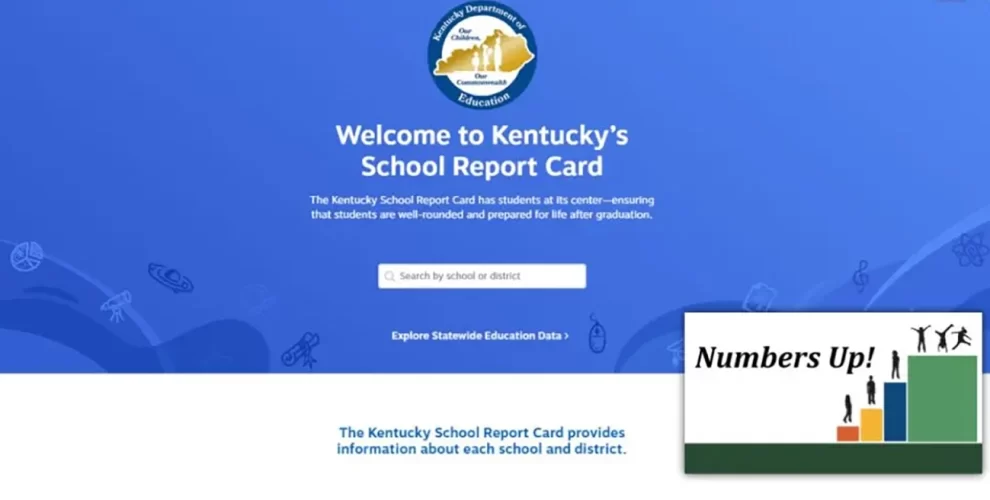
Basic Navigation
The report card site starts by asking you to choose a school. When you choose, the first thing you see on each school’s page is an announcement of what isn’t available: the pandemic cancelled statewide assessments and made it impossible to report 2019-20 school ratings.You’ll need to scroll down to find the other data that is available, in sections showing an Overview, Academic Performance, Educational Opportunity, School Safety, and School Finance. For high schools, you’ll also find a section on Transition to Adult Life. Off to the right in each section, there are menus that will take you to more information: so much information that I’ve never been able to absorb it all in one sitting.I recommend a simpler approach: scroll through the landing page to see the main charts, and then look at other sections for information that draws your interest or aligns with your enduring concerns. For me this year, the eye-catching information about our local Danville schools included enrollment data, course offering information, and new charts showing performance goals for the next ten years.
Enrollment
Here are the first two charts for Toliver Elementary School.My kids are adults now, so I don’t keep up with the basic statistics as consistently as I once did. 71% students being economically disadvantaged students is a 20-point increase from the first time I heard teachers discuss the schools’ free/reduced-price meal participation. And 59.6% white (non-Hispanic) is at least 15-point drop from when we moved to Danville. Both changes are likely to shift the skills teachers use to build on each student’s strengths, and both are likely to change the community supports that would be most helpful to the schools.
Arts Opportunities
In the Education Opportunity section, the link for General Education Coursework took me to this chart of John W. Bate Middle School’s arts offerings.That shows 945 minutes of weekly instruction! After a moment of being dazzled, I remembered that a standards instructional week has 1,800 minutes — and I don’t think it can mean that every student spends more than half of the week working in the arts. Hunting for more information I scrolled down to this list of course offerings.Bate had 425 students last year, and the chart shows a smaller number participating in each kind of arts learning. That also reminds me that middle schools often offer “rotations” through the arts and some other subjects, so the 91 students in the “comprehensive visual arts” may be in that course for half the year or a quarter of the year. Or maybe there’s another explanation of how the arts are offered.Puzzles like this are opportunities to ask questions at the school and learn more—and asking questions is a good form of citizen engagement. Plus, arts in our schools need extra attention from communities because Kentucky accountability doesn’t use assessment data on those subjects. When you’re looking at your school’s data, I hope you won’t expect yourself to understand everything you see: on the contrary, wanting to learn more is a sign of successful reading.
State Goals and Trends
New this year, the school report cards show a call for each school to deliver stronger results for students, offering charts of “progress toward state goals” that look like this one for Danville High.These charts are in the Academic Performance section, reached by clicking to see “Assessment Results.” The green dots call for the school to get halfway to 100% proficient by 2030. In the example, at Danville High School, 40% were proficient in reading in 2019, and the chart asks for that to be 70% by 2030. Right now, there’s only one blue triangle showing actual performance, but the plan is clearly to add results each year showing where each school stands in relation to each goal.Each school’s report card also has charts for student groups, asking for the same “half-way to 100%” movement by 2030. That means a school is asked to deliver different results for each student group each year, though upward movement is expected for everyone. Here are two for Danville High.Clearly, Kentucky is asking the high school to deliver faster progress for African American students than for white students. Clicking on the green dots let me see a label for each year’s goal. In 2019, 22.2%% of African American students and 52.2% of white students were proficient in reading. The goals for 2030 are 61.1% of African American students and 76.1% of white students proficient. In 2019, the results were 30 points apart, and the charts ask the high school to reduce that gap to 15 points by 2030.This approach to setting goals is one of the most ambitious parts of the plan Kentucky submitted to the federal government under the Every Student Succeeds Act (also known as ESSA). For every group, and for every subject, these charts ask for big movement. For citizen activism, these expectations can be an important target. Ask your school board members to share the main strategies your schools will be using to make this level of big progress. Attend some school council meetings and listen for discussion of challenges and ways to meet them.
State Goals and Trends
I hope you’ll read your own Kentucky School Report Card looking for your own surprises, puzzles, and challenges. Especially, I hope you find a few areas where you can ask more questions and engage more fully with understanding and supporting the work of building excellence for our rising generation.