


Income, Race and Cross-Tabulated Insights

Crosstabs! The data files for the Kentucky school report card have crosstabs! Users can now choose an assessment subject and see results sorted by two different factors in students’ lives. This is a powerful upgrade!
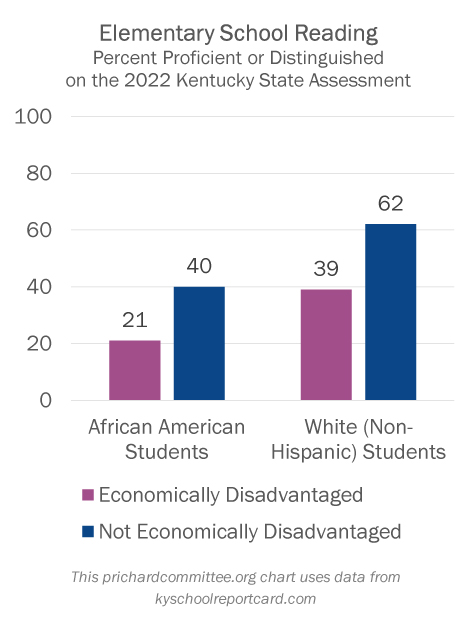
As a very first example, these files offer new evidence about whether the continuing issue of lower scores for African American students can be “explained” by lower family incomes. Here’s a 2022 reading display, showing state statewide percent proficient or distinguished, broken out to show African American and white students with and without economic disadvantage. How would you summarize it?
I’d say that family economic resources aren’t enough level to the playing field for African American students. The chart doesn’t show give any evidence about how much of the difference is created in school and how much is created elsewhere. But whatever the social process involved, this evidence shows African American students with relatively solid family finances and white students with low family incomes with very similar results: 40% proficiency compared to 39%. This evidence doesn’t support claims that income differences can “explain” racial ones.
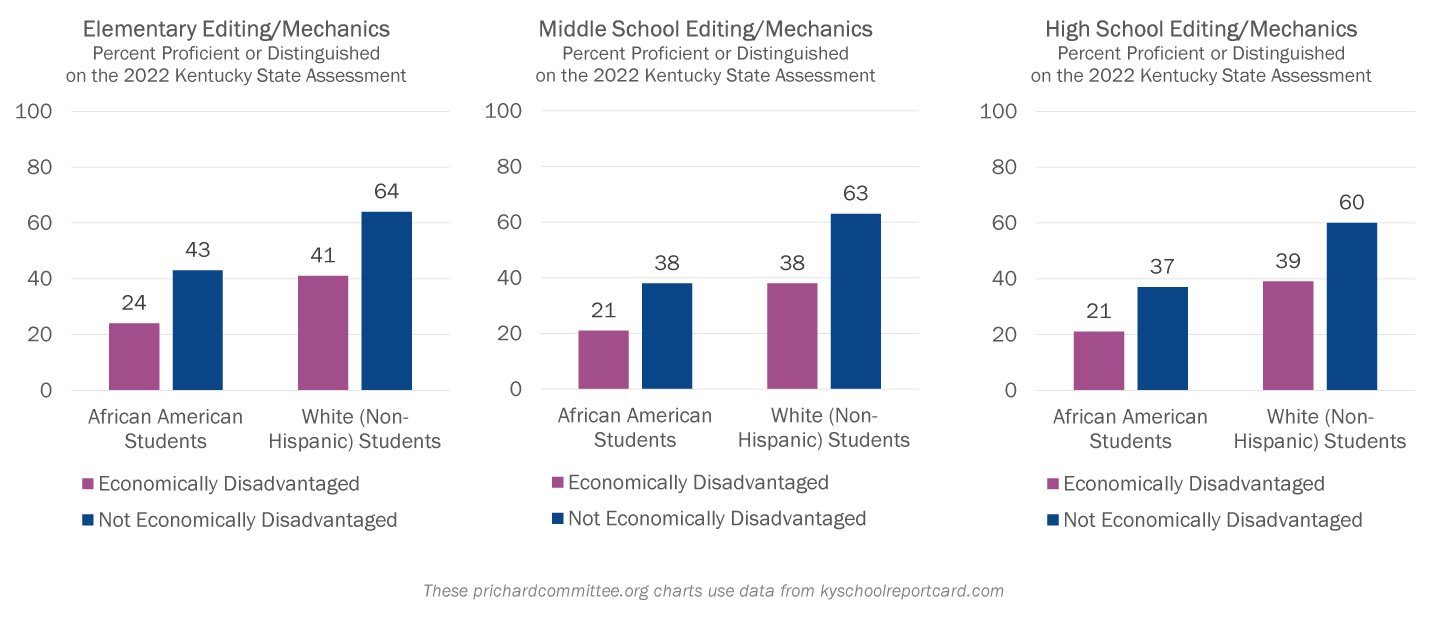
In middle and high school reading, African American students without economic disadvantage and white students with economic disadvantage scored identical levels of proficiency.
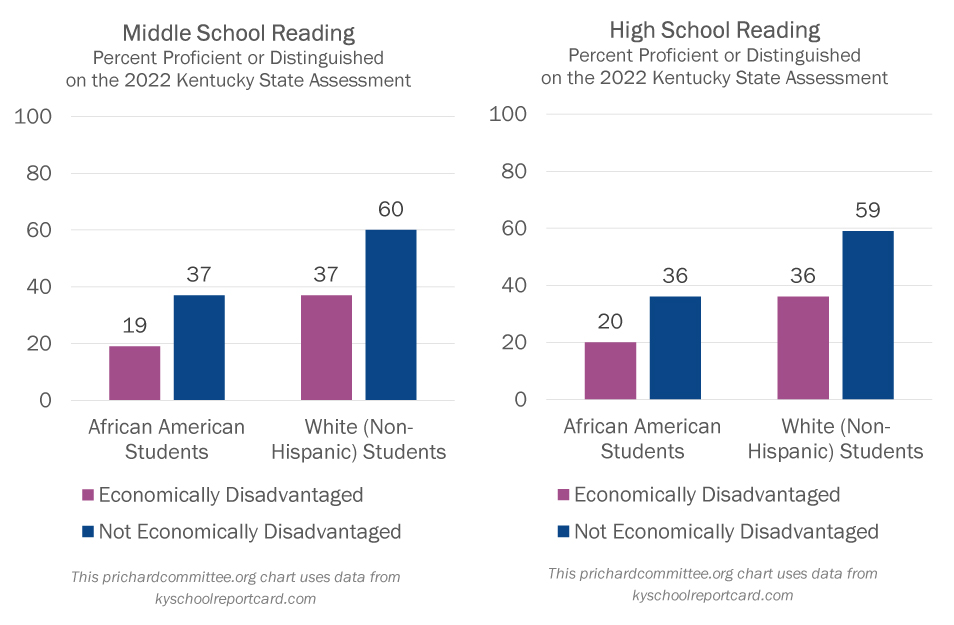
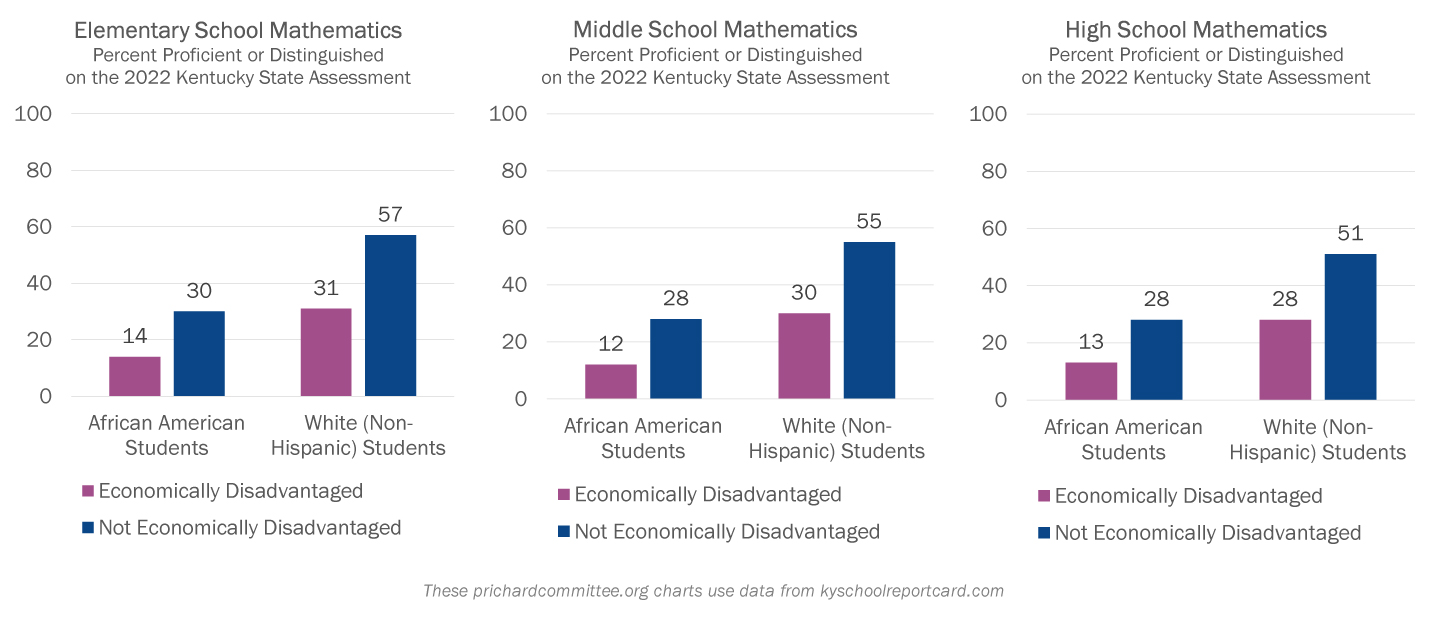
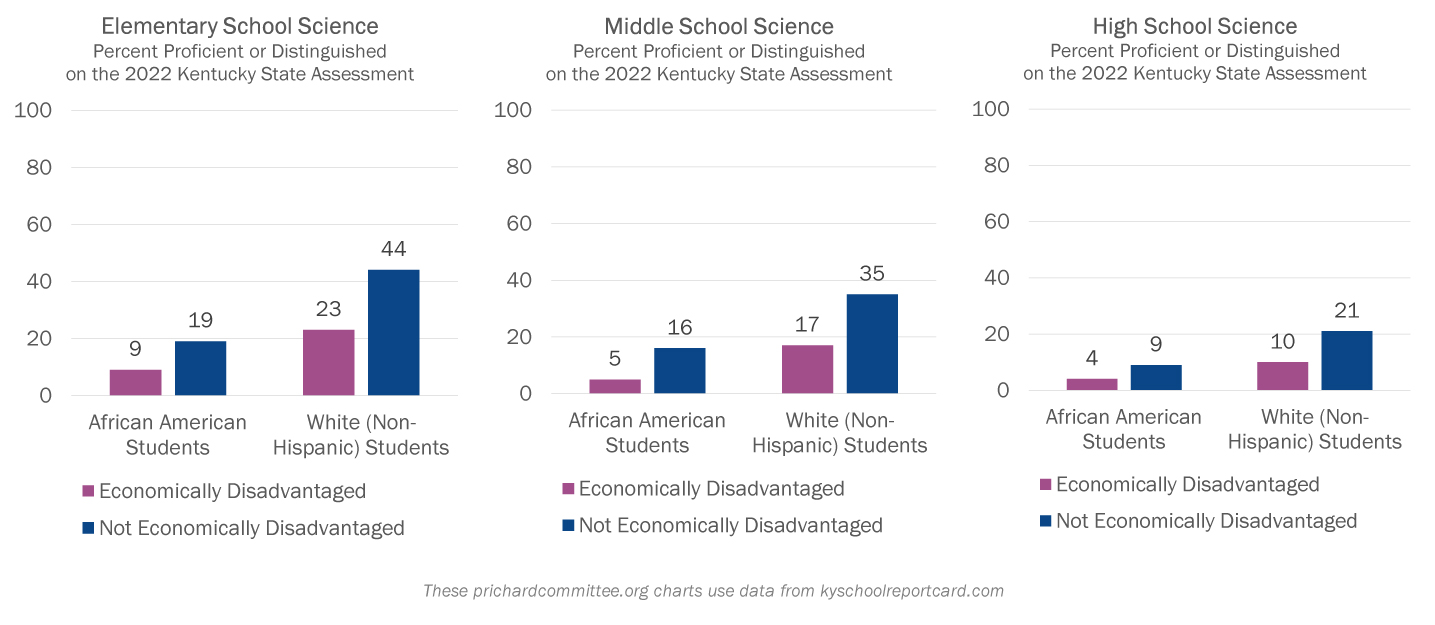
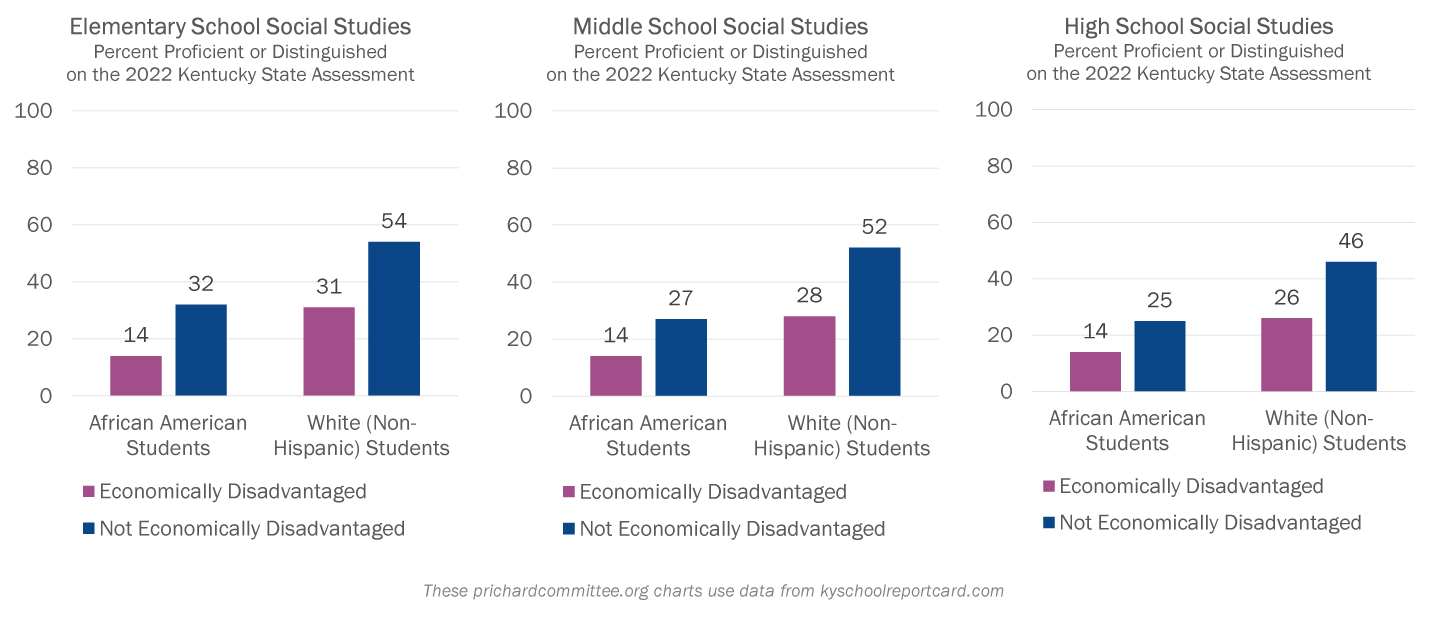
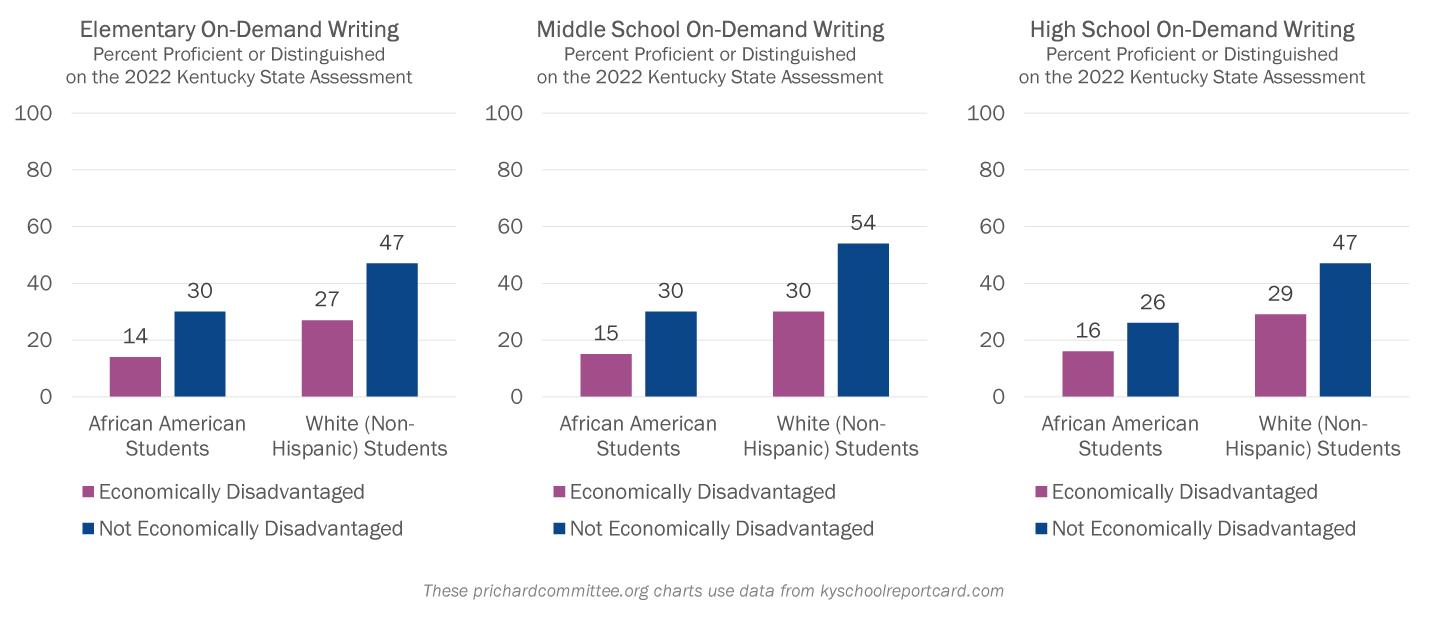
In fact, the pattern is fundamentally consistent across six assessments at three levels, as shown in the charts at the bottom of this post.
What can we learn from seeing this? To me, these numbers are powerful added evidence that we still live in a society shaped by enslavement, segregation, and bigotry. Even while many of us now work to build communities where we can all thrive and our children can all flourish, the work isn’t close to being done.
Sharing cross-tabulated data gives us one more way see that. I’m grateful for this upgrade in evidence-sharing from the Department of Education, and looking forward to studying other issues and challenges with these new tools. If you want to join the exploration, visit kyschoolreportcard.com/datasets?year=2022,scroll down to the Accountability section at the bottom. There, clicking on the little plus signs for each subject will let you download the cross-tabulated version of that set of results.