


Access to Advanced Coursework: Forecast
Forecast Trajectory: An Overview
Using the historical data obtained from the Kentucky Department of Education (KDE) School Report Card Suite, our forecast trends are generated with the “Forecast Sheet” function in Excel.
The “Forecast Sheet” in Excel function uses the Holt-Winters Model, or Triple Exponential Smoothing (TES) method to generate forecast trends. Exponential smoothing is a commonly used statistical method for time series forecasting, and it works by assigning exponentially decreasing weights to older data points. This allows the forecast to adapt to recent trends while also incorporating historical data.
The settings used for generating these forecasts are as follows:
- Forecast Start and End Dates: The forecast starts from the academic year 2023-2024 and extends to 2026-2027.
- Confidence Interval: A 95% confidence interval is applied to the forecast, which provides a range within which future data points are likely to fall with a high degree of confidence.
- Fill Missing Points: Missing data points are filled using interpolation to ensure a smooth and continuous trend line.
- Aggregate Duplicates: Duplicate data points are aggregated using averages to reduce redundancy and improve the accuracy of the forecast.
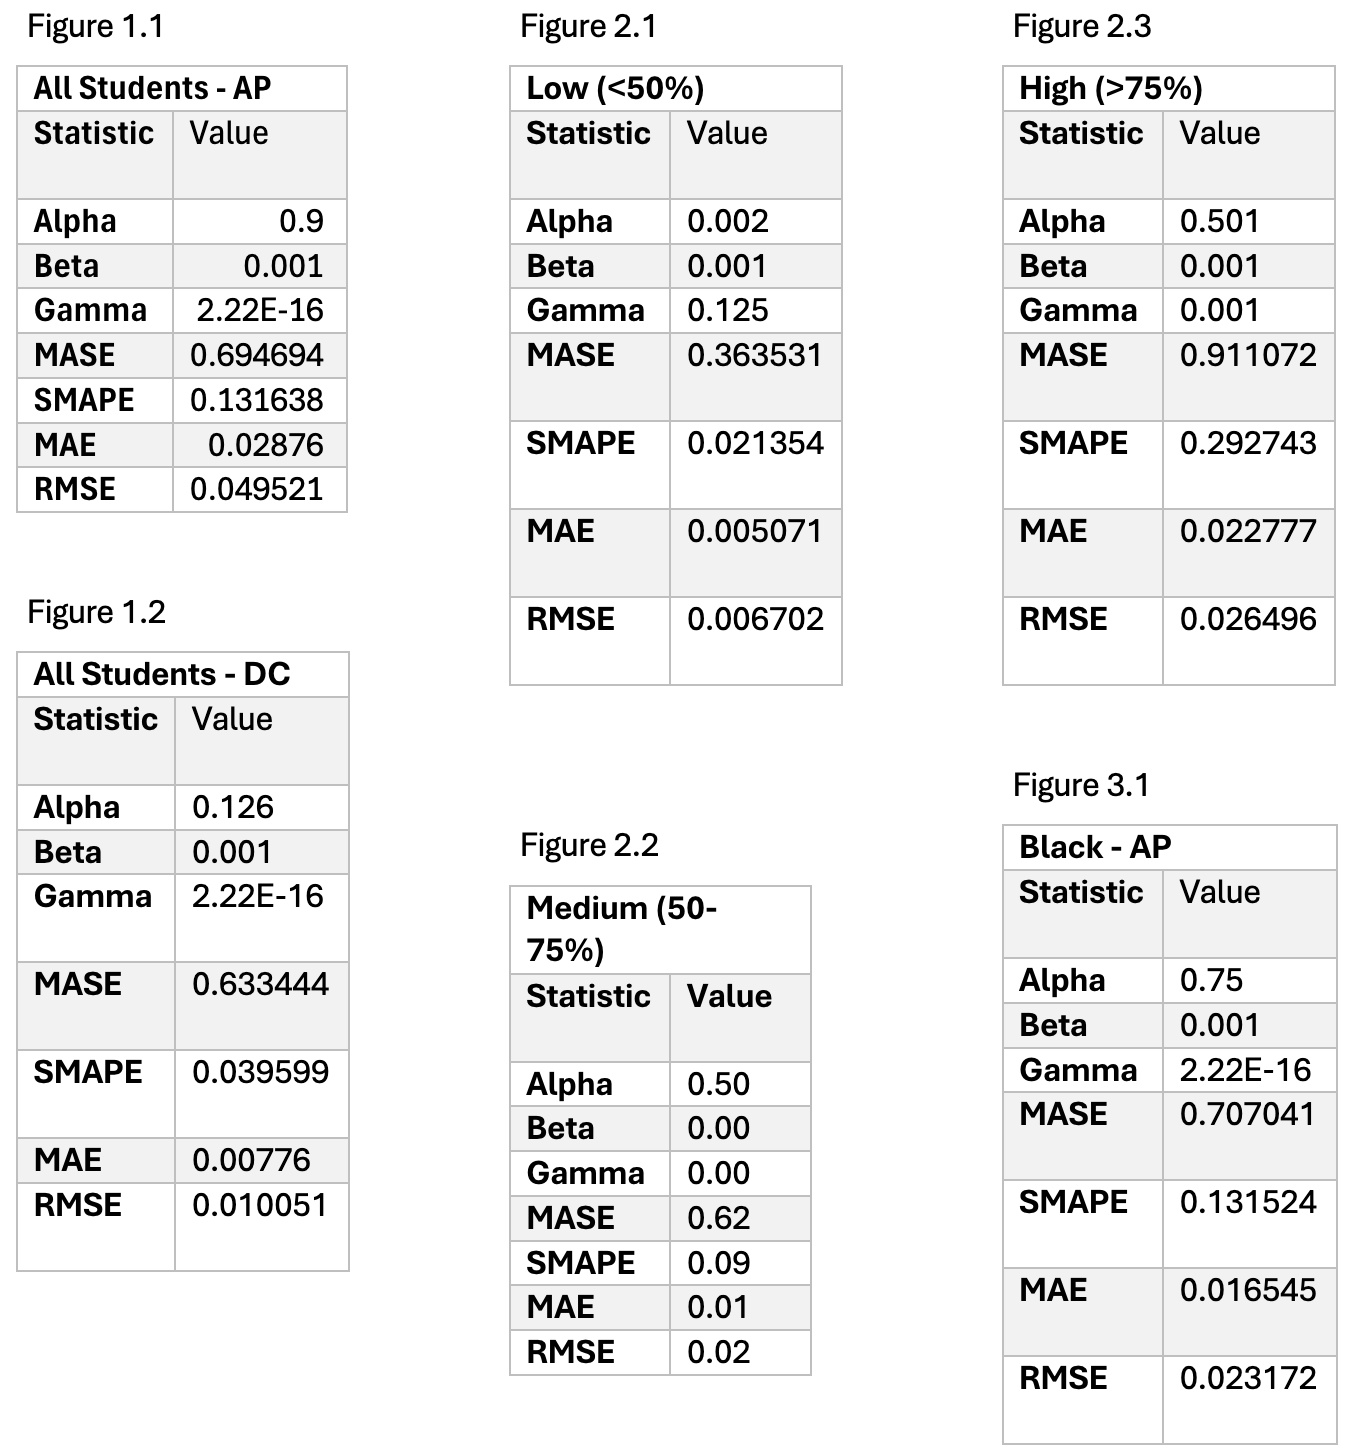
- Evaluate Forecast Accuracy: Excel provides the following forecast key performance indicators (KPIs) to serve as measures of accuracy or performance of the forecast model.
- Alpha, Beta, Gamma (Smoothing Parameters)
- MASE (Mean Absolute Scaled Error)
- SMAPE (Symmetric Mean Absolute Percentage Error)
- MAE (Mean Absolute Error)
- RMSE (Root Mean Squared Error)
- For more information on forecast KPIs, please visit the following resources:
Data Outcome #1: High School Advanced Coursework Enrollment
Figure 1.1
Historical Data and Forecast Trend of High School Advanced Coursework Enrollment – Advanced Placement (AP) – All Students in Kentucky.
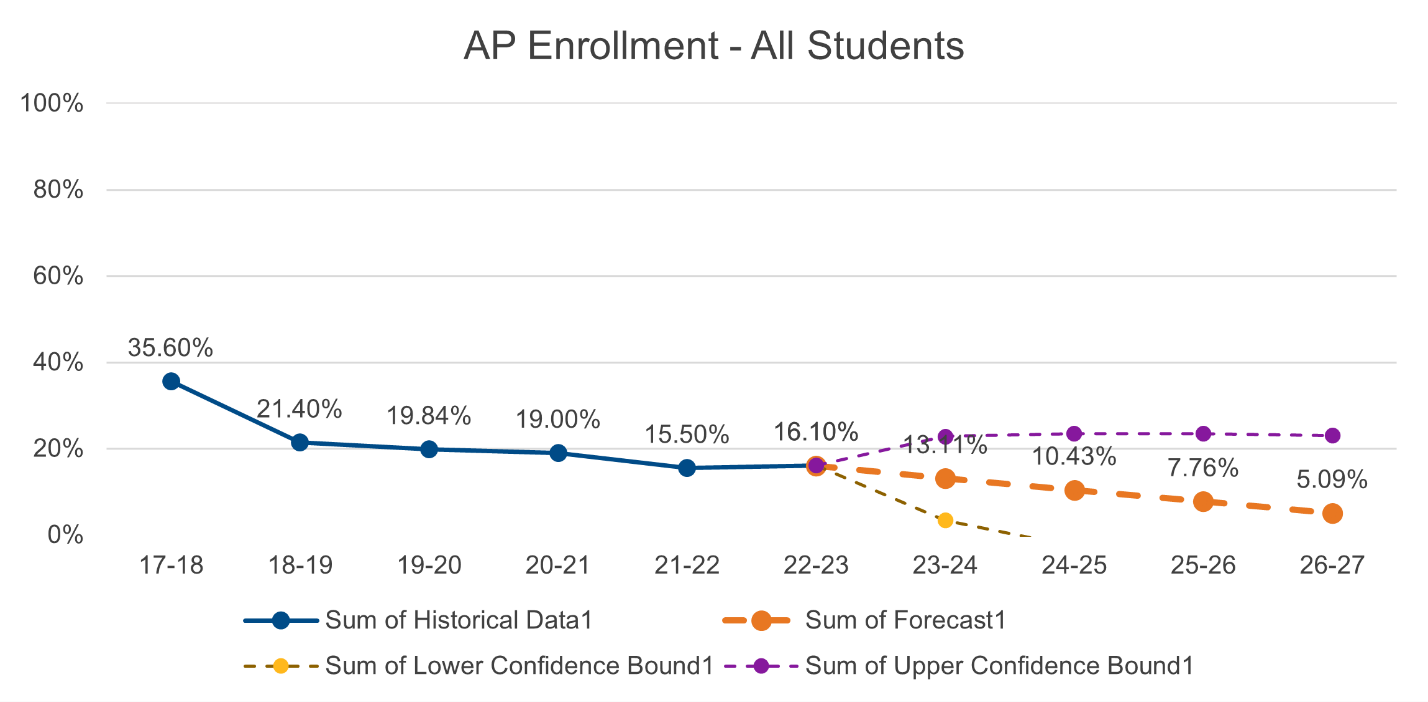
Source: Kentucky Department of Education (KDE) School Report Card
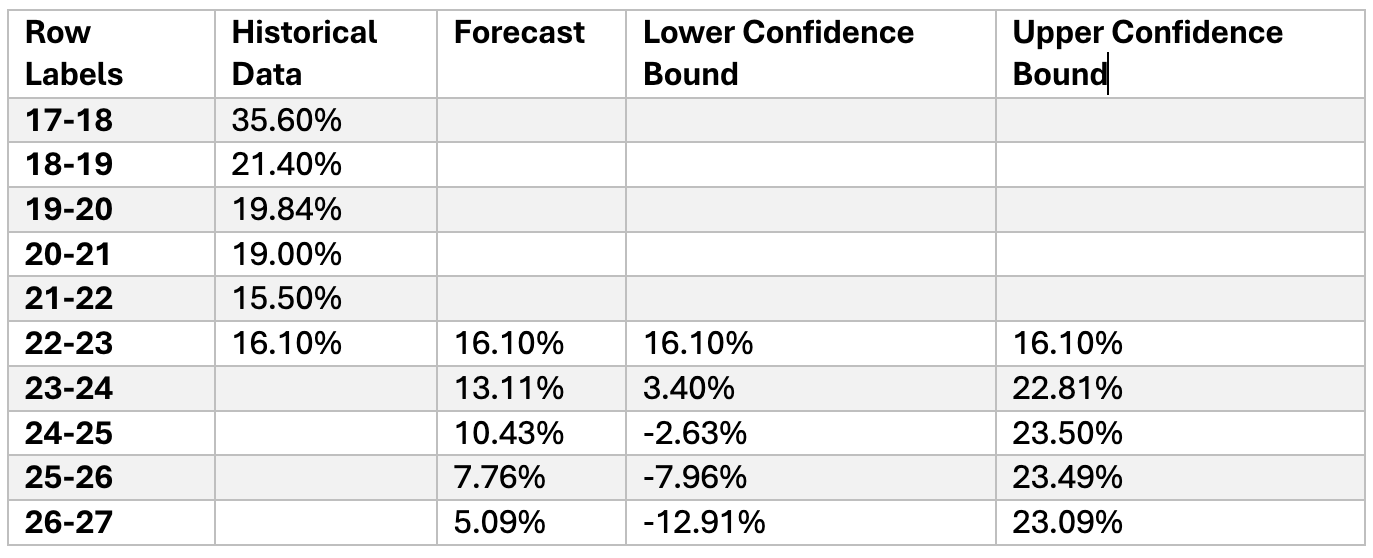
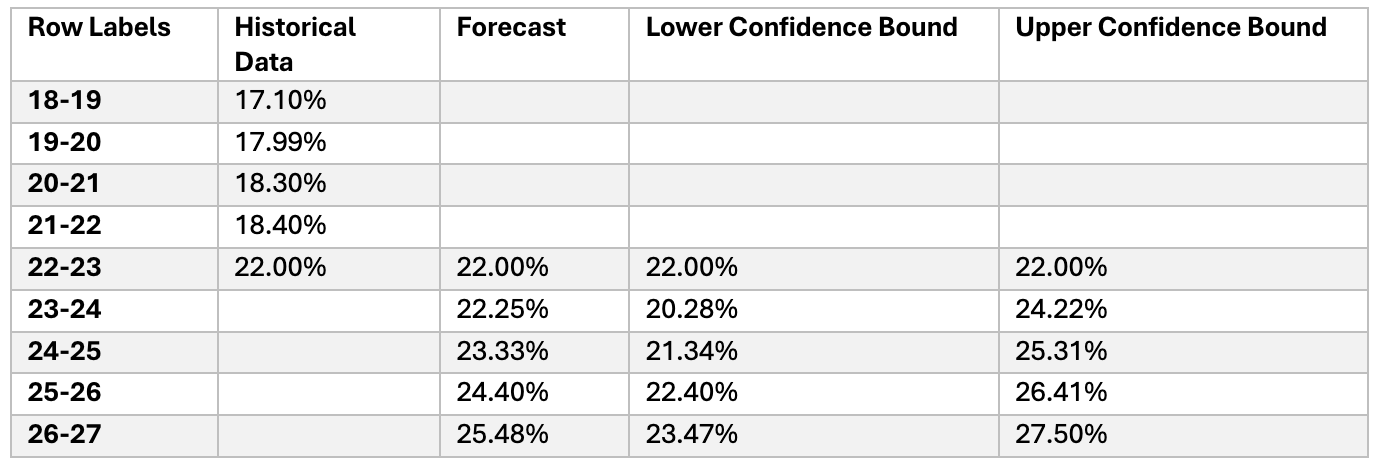
Figure 1.2
Historical Data and Forecast Trend of High School Advanced Coursework Enrollment – Dual Credit (DC) – All Students in Kentucky.
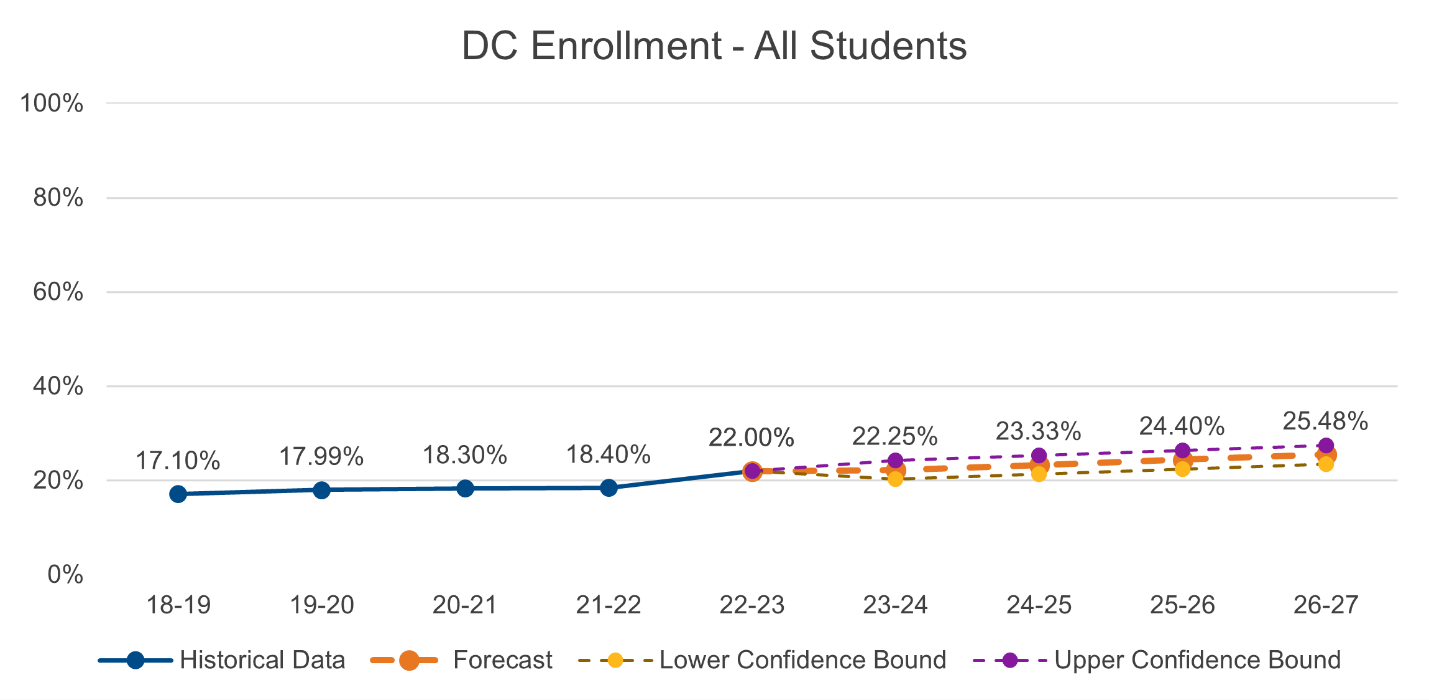
Source: Kentucky Department of Education (KDE) School Report Card
Data Outcome #2: High School Advanced Placement and Students from Low-Income Backgrounds
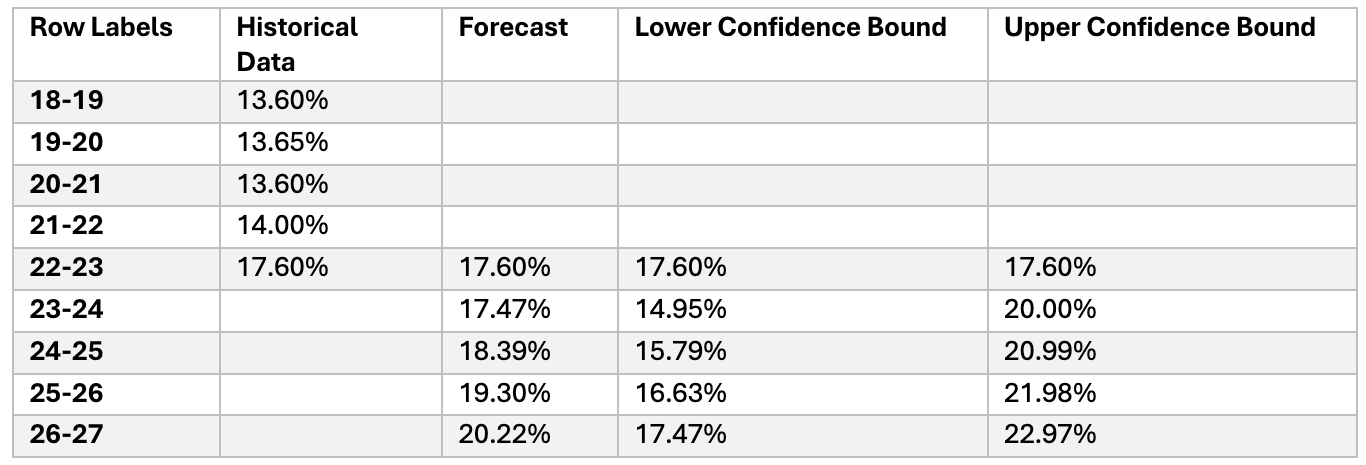
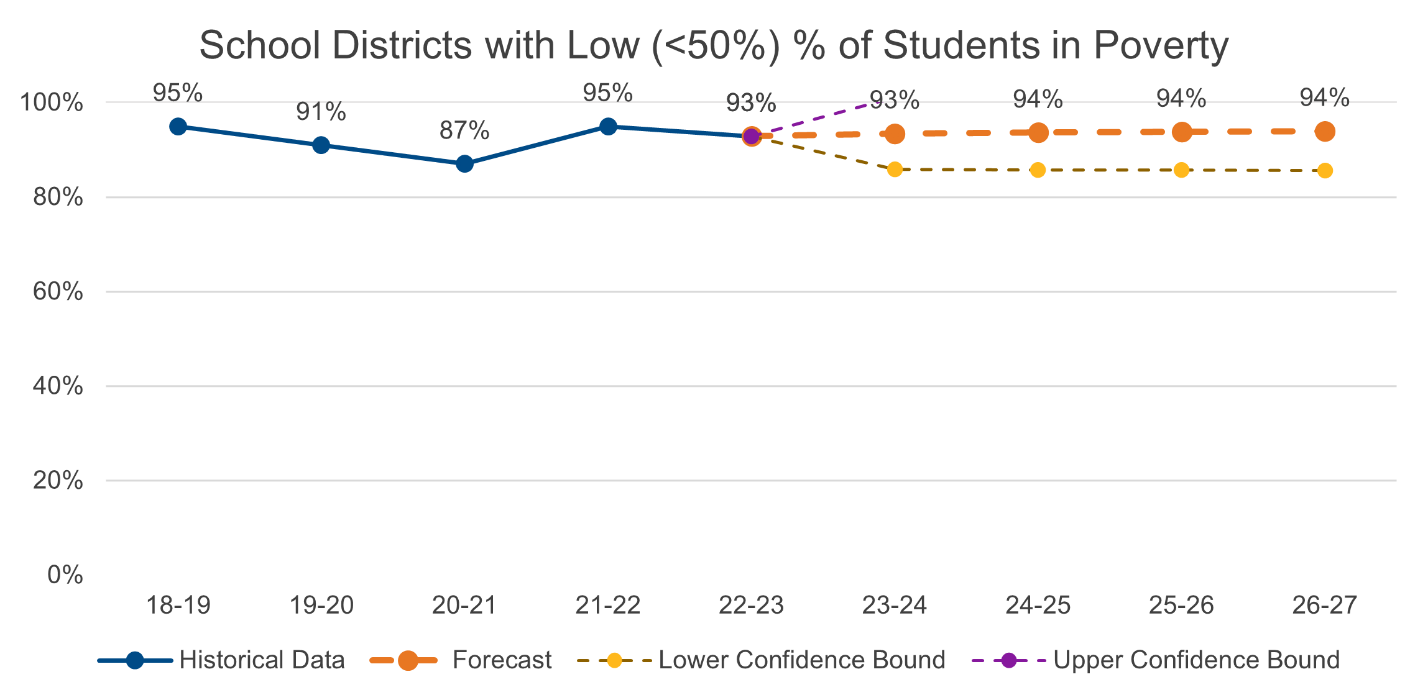
Figure 2.1
Historical Data and Forecast Trend of High School Advanced Coursework Enrollment – Advanced Placement (AP) – School Districts with 50 Percent or Fewer Economically Disadvantaged Students.
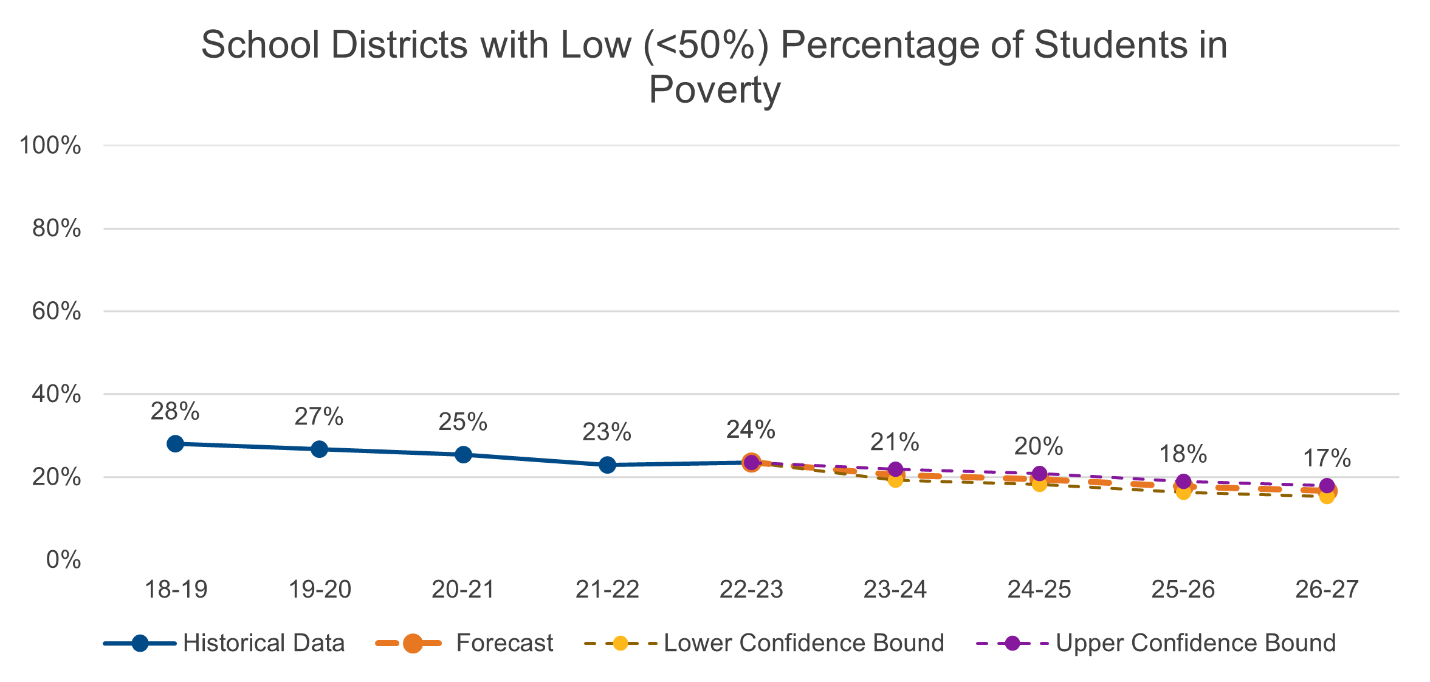
Source: Kentucky Department of Education (KDE) School Report Card
Note: The data value for the year 2019-2020 was estimated using the Excel ‘Forecast Sheet’ function. The method employed is known as ‘interpolation.’ Interpolation is a technique used to predict values within the range of an existing data set. This technique allows for the estimation of data points based on known values.
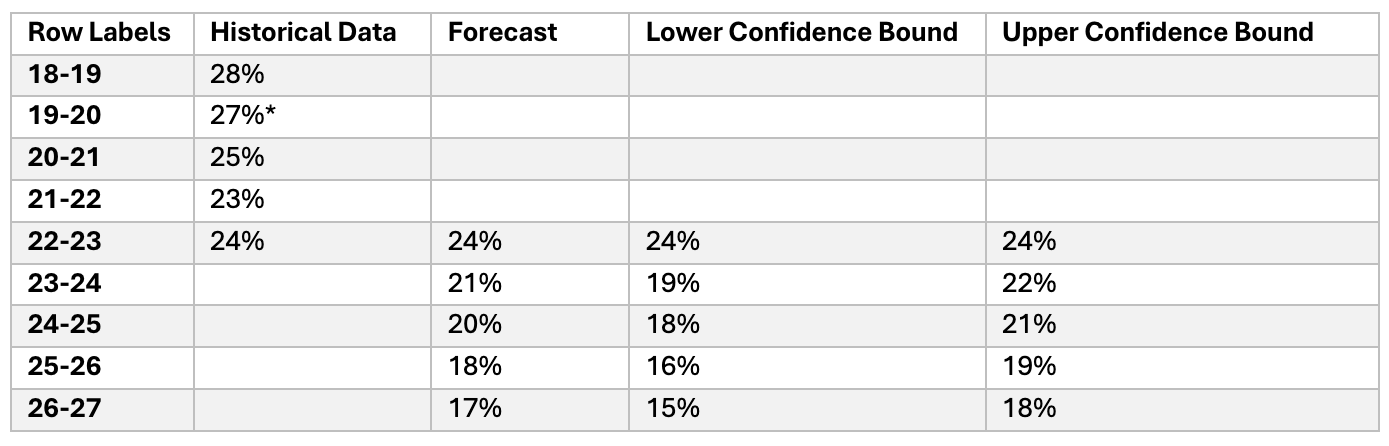
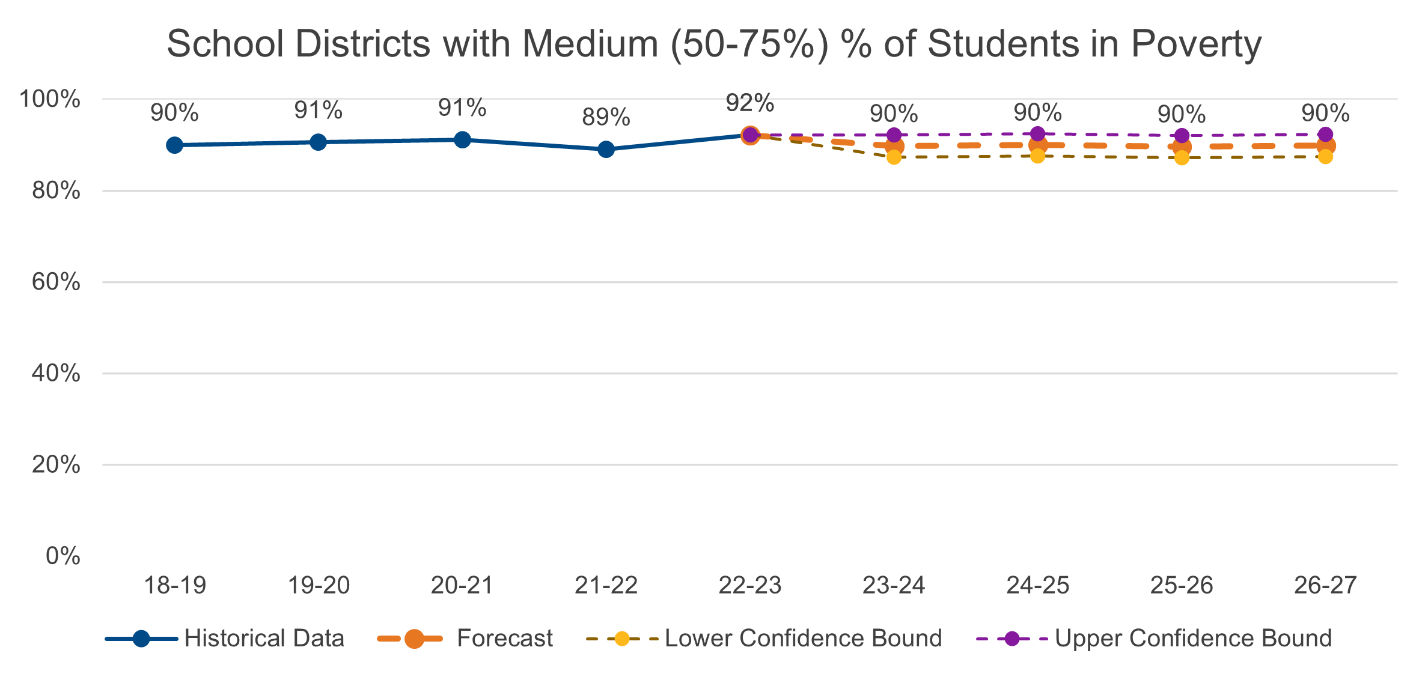
Figure 2.2
Historical Data and Forecast Trend of High School Advanced Coursework Enrollment – Advanced Placement (AP) – School Districts with between 50 and 75 Percent Economically Disadvantaged Students.
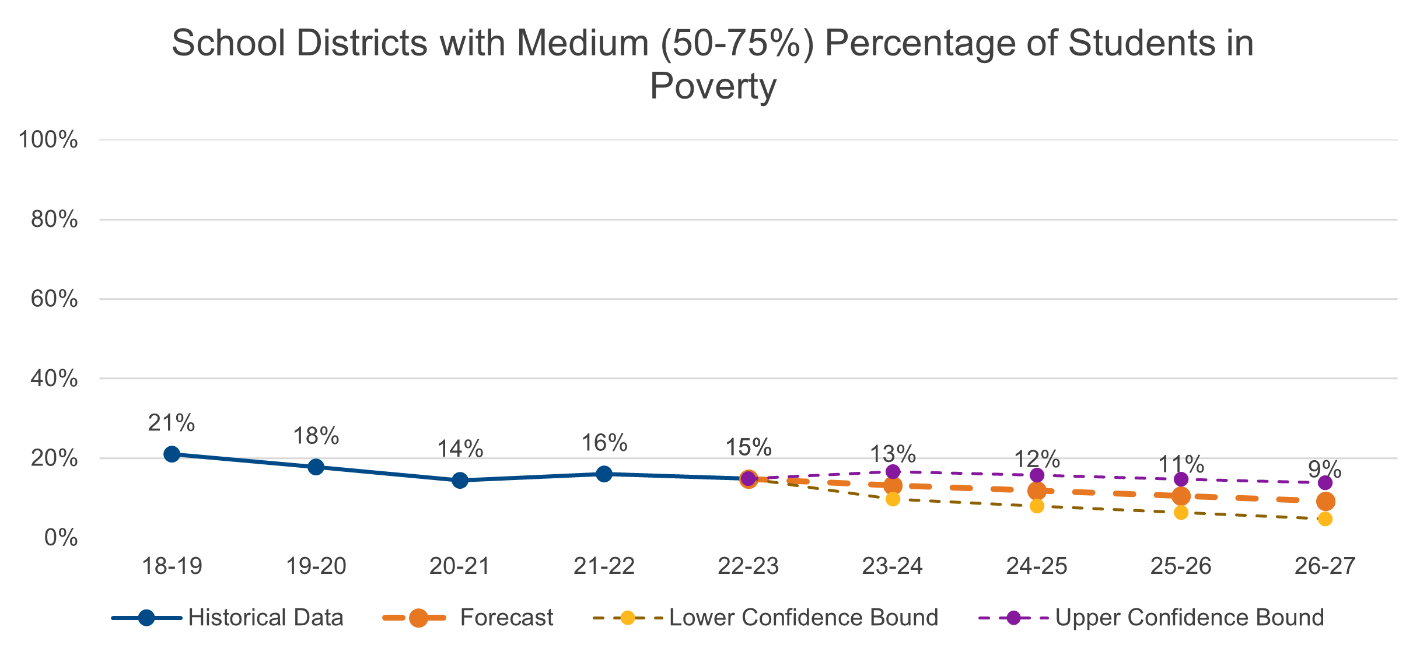
Source: Kentucky Department of Education (KDE) School Report Card
Note: The data value for the year 2019-2020 was estimated using the Excel ‘Forecast Sheet’ function. The method employed is known as ‘interpolation.’ Interpolation is a technique used to predict values within the range of an existing data set. This technique allows for the estimation of data points based on known values.
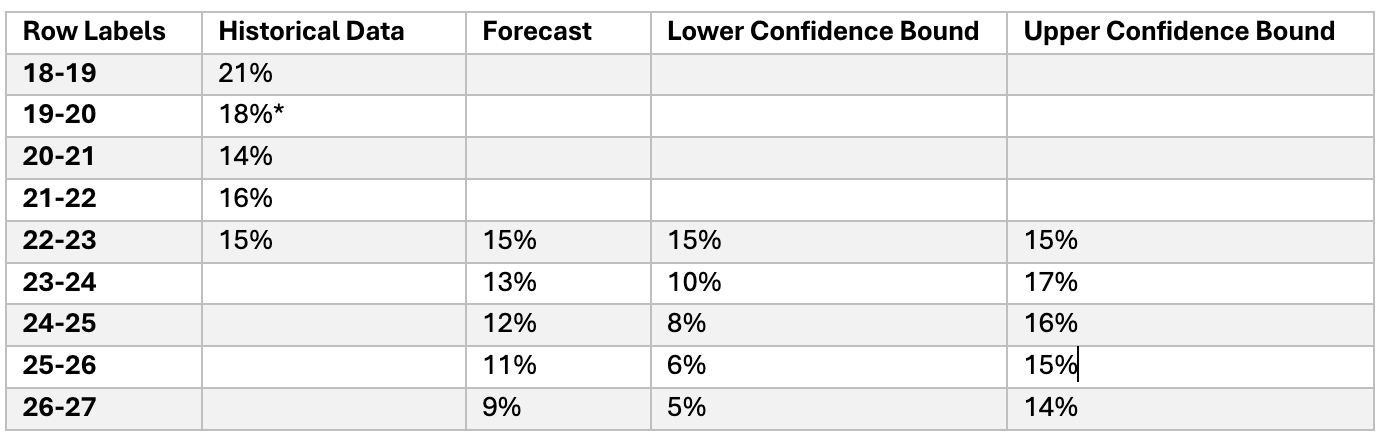
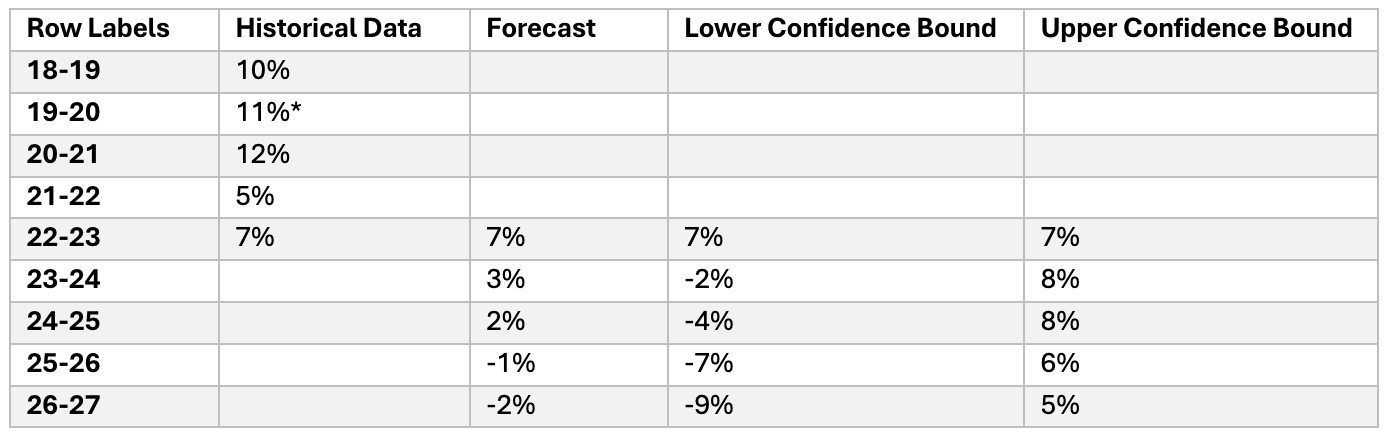
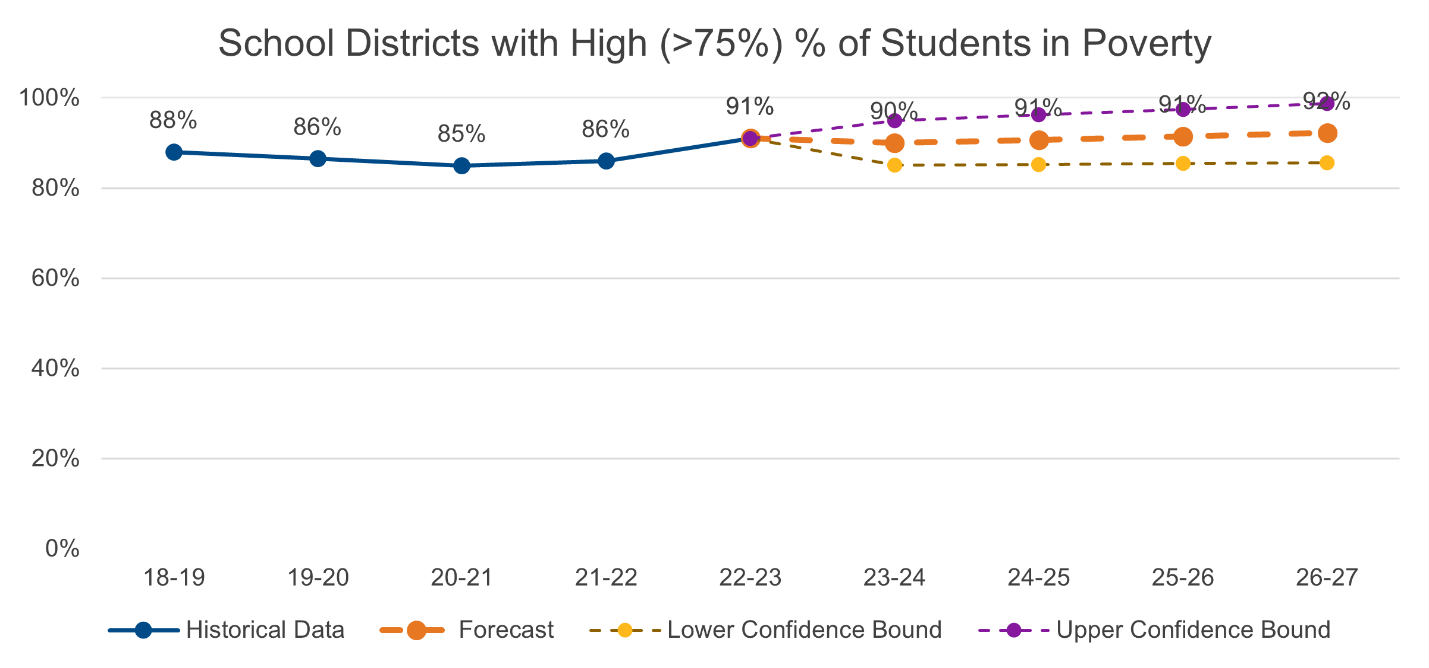
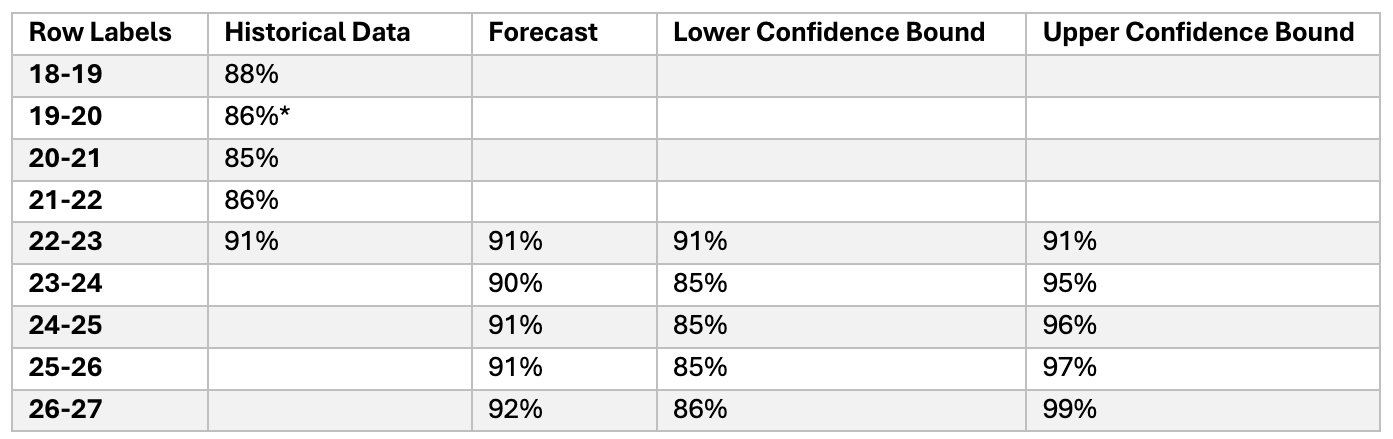
Figure 2.3
Historical Data and Forecast Trend of High School Advanced Coursework Enrollment – Advanced Placement (AP) – School Districts with 75 Percent or More Economically Disadvantaged Students.
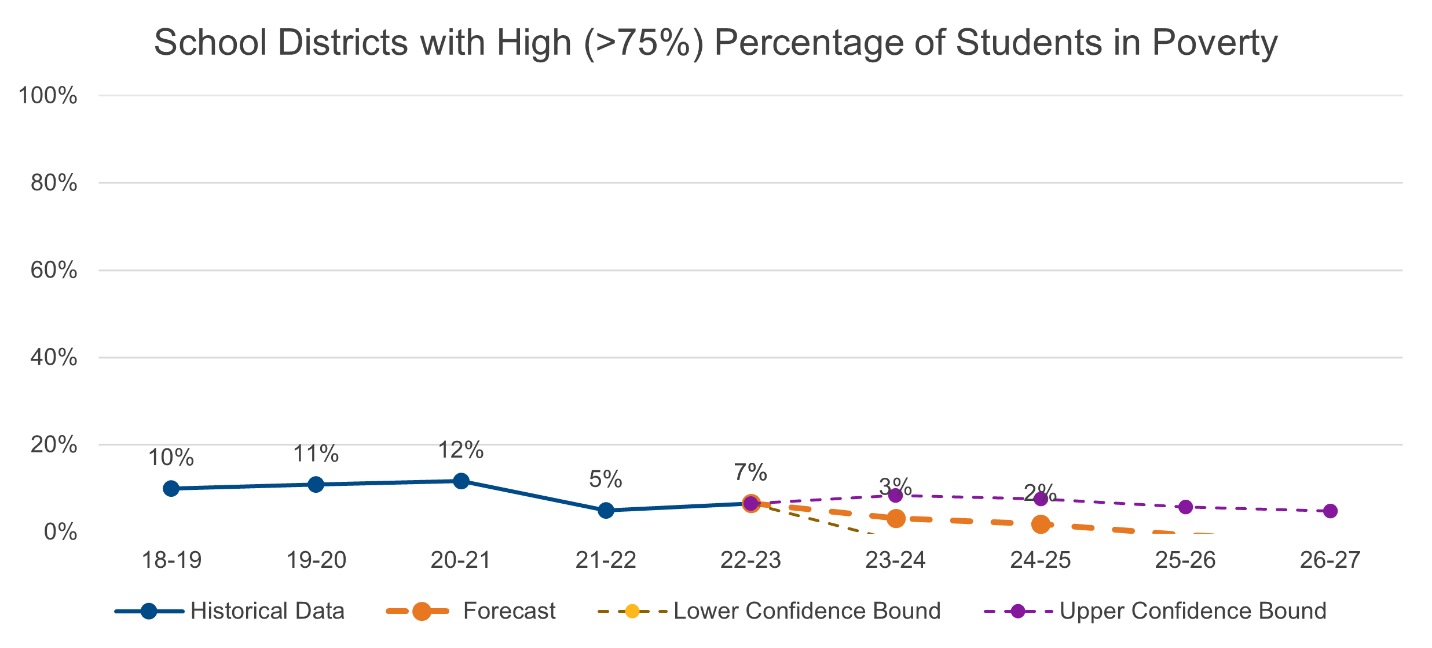
Source: Kentucky Department of Education (KDE) School Report Card
Note: The data value for the year 2019-2020 was estimated using the Excel ‘Forecast Sheet’ function. The method employed is known as ‘interpolation.’ Interpolation is a technique used to predict values within the range of an existing data set. This technique allows for the estimation of data points based on known values.
Data Outcome #3: High School Advanced Coursework and Diverse Student Populations
Figure 3.1
Historical Data and Forecast Trend of High School Advanced Coursework Enrollment – Advanced Coursework (AP) – Black Students.
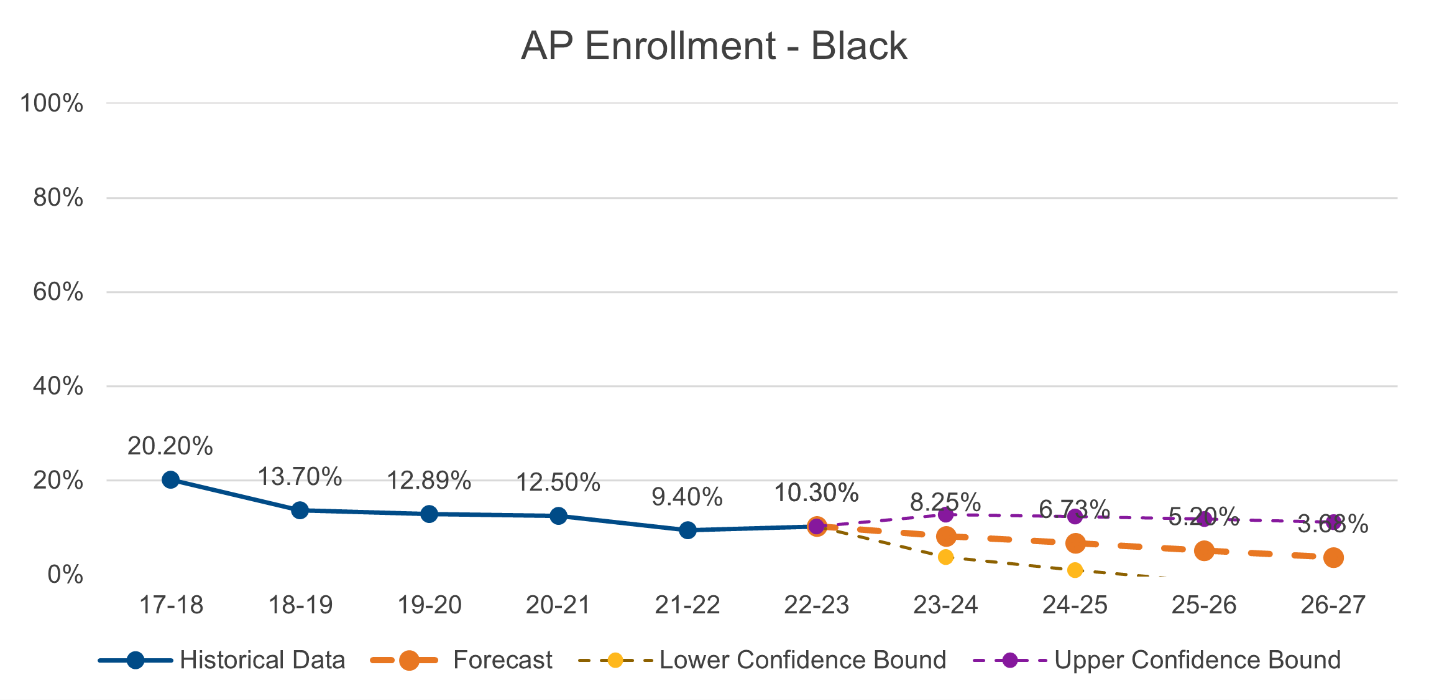
Source: Kentucky Department of Education (KDE) School Report Card
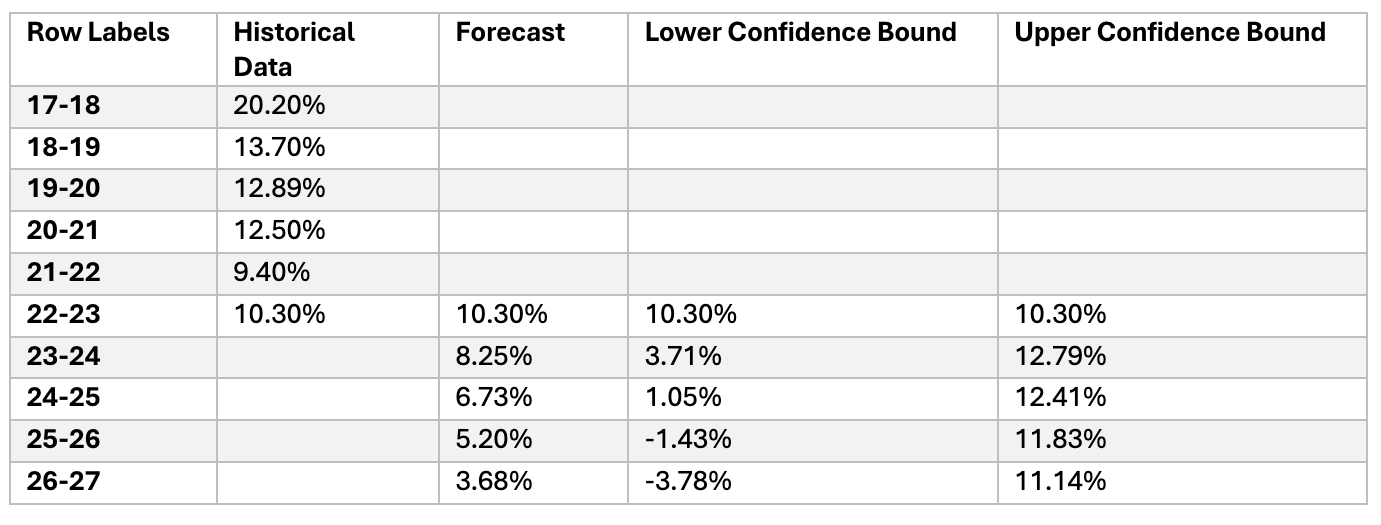
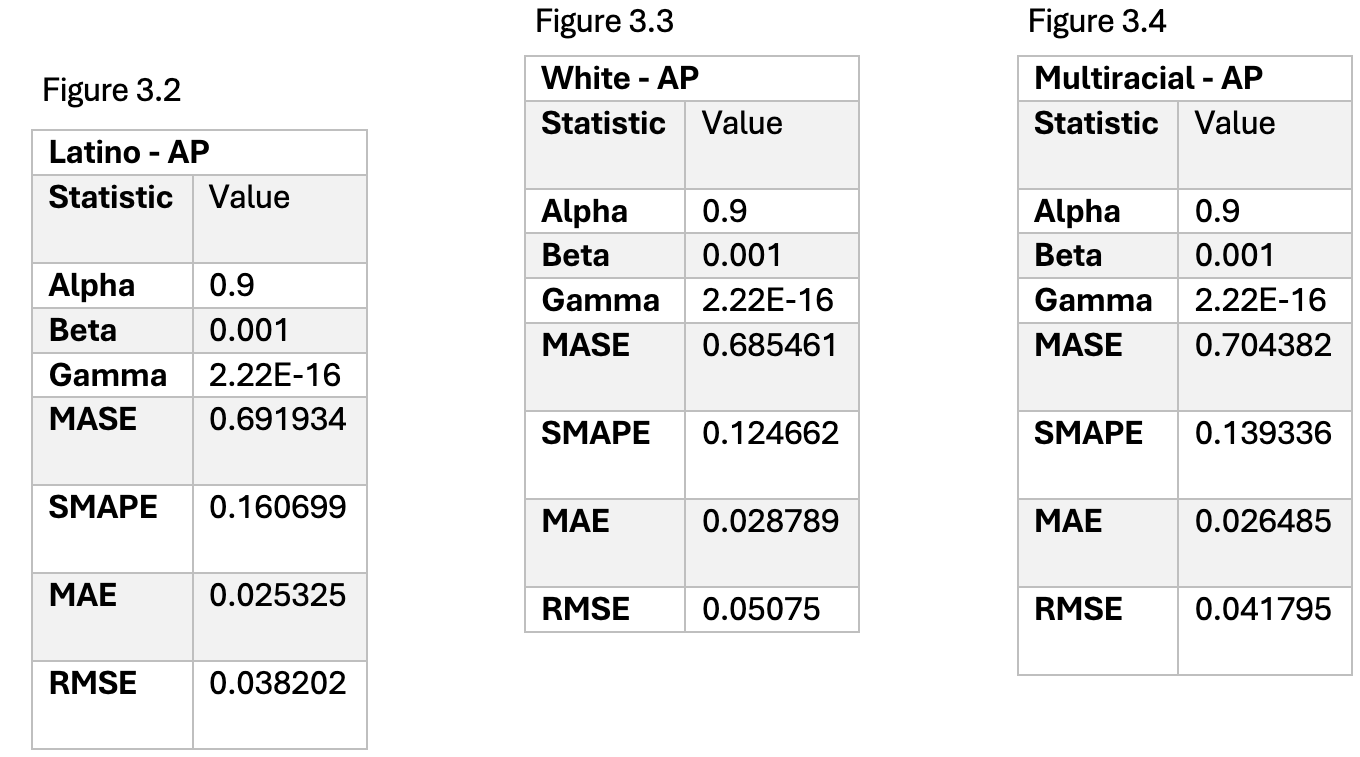
Figure 3.2
Historical Data and Forecast Trend of High School Advanced Coursework Enrollment – Advanced Coursework (AP) – Latino Students.

Source: Kentucky Department of Education (KDE) School Report Card
Figure 3.3
Historical Data and Forecast Trend of High School Advanced Coursework Enrollment – Advanced Coursework (AP) – White Students.
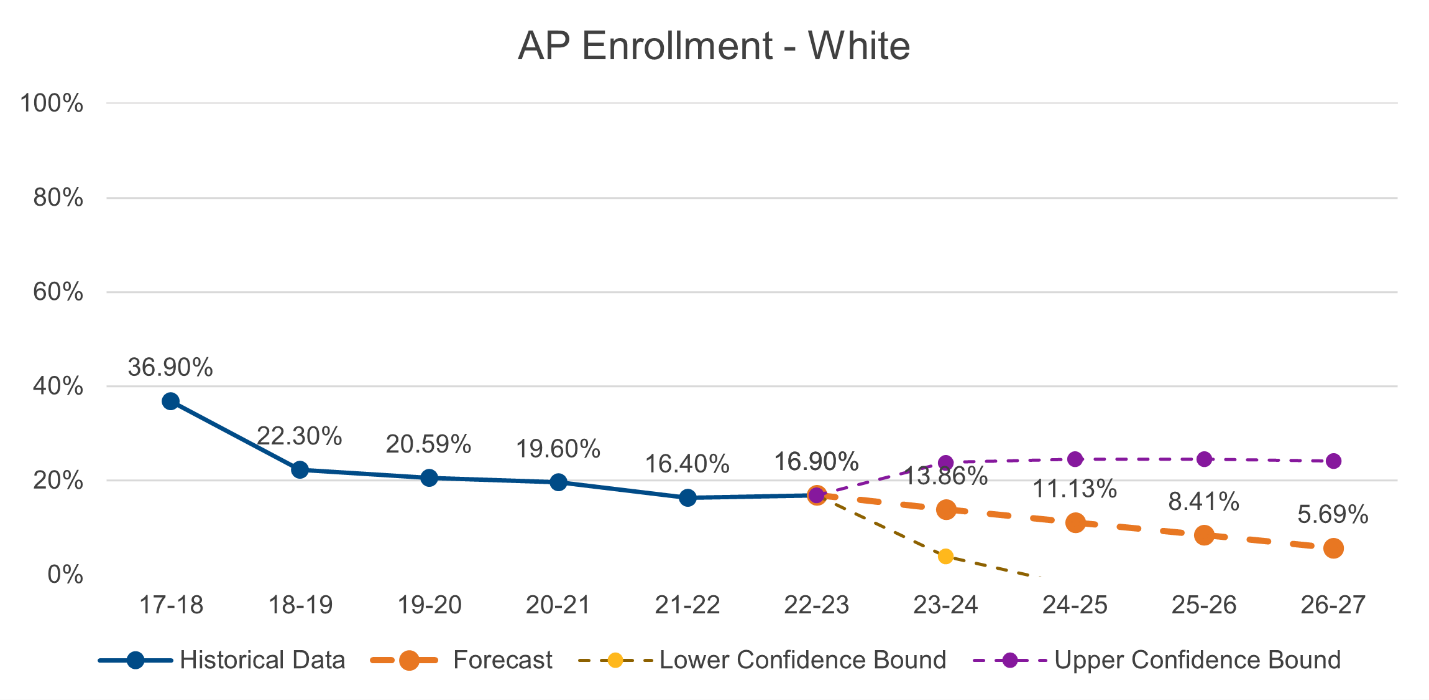
Source: Kentucky Department of Education (KDE) School Report Card
Figure 3.4
Historical Data and Forecast Trend of High School Advanced Coursework Enrollment – Advanced Coursework (AP) – Multiracial Students.
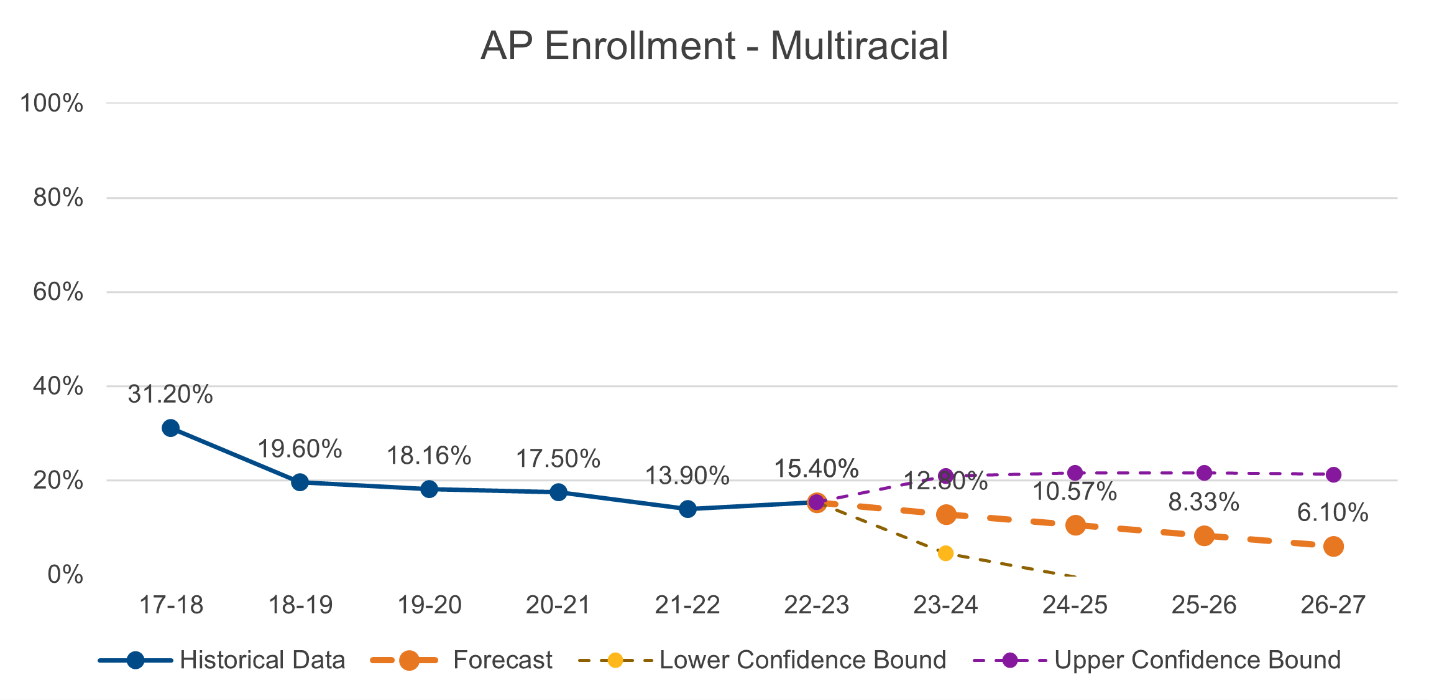
Source: Kentucky Department of Education (KDE) School Report Card
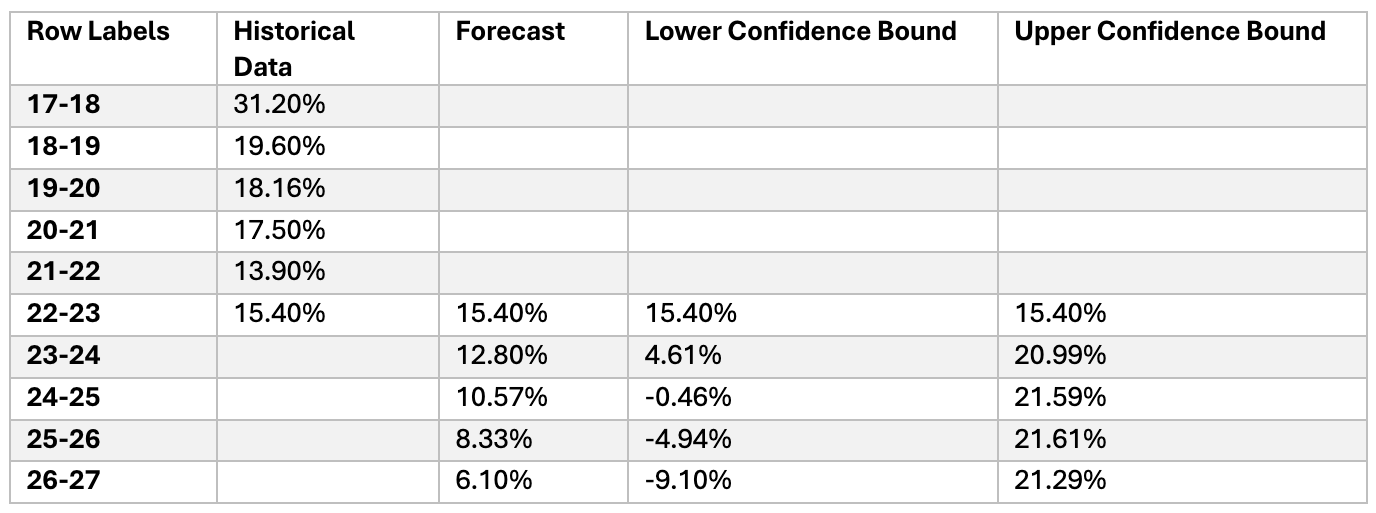
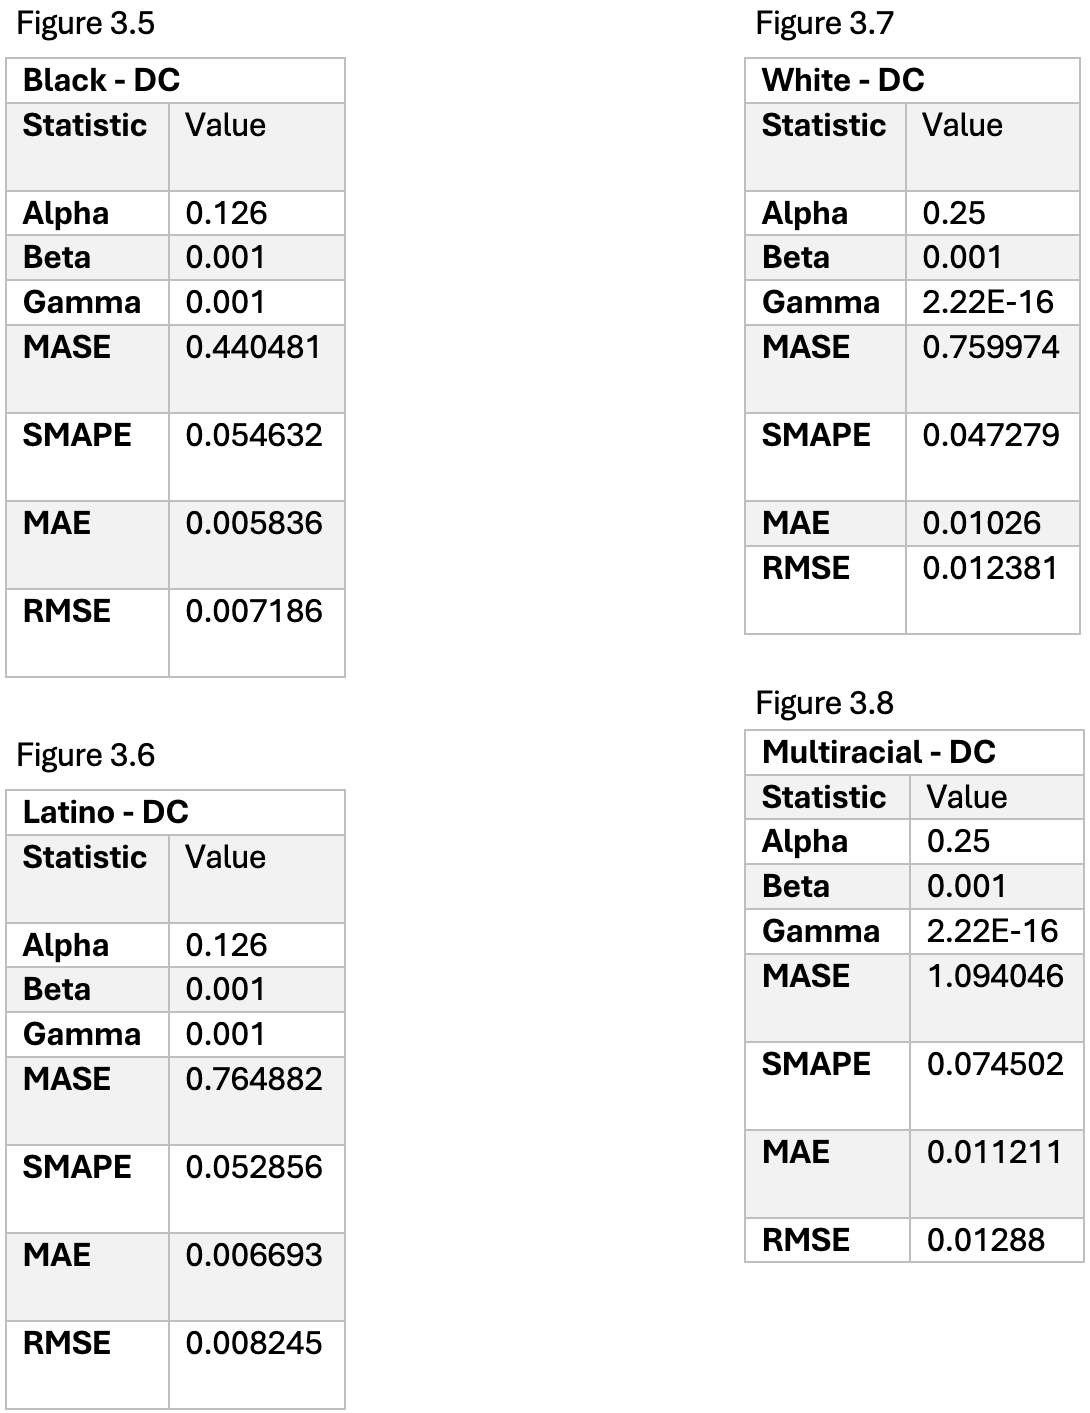
Figure 3.5
Historical Data and Forecast Trend of High School Advanced Coursework Enrollment – Dual Credit (DC) – Black Students.
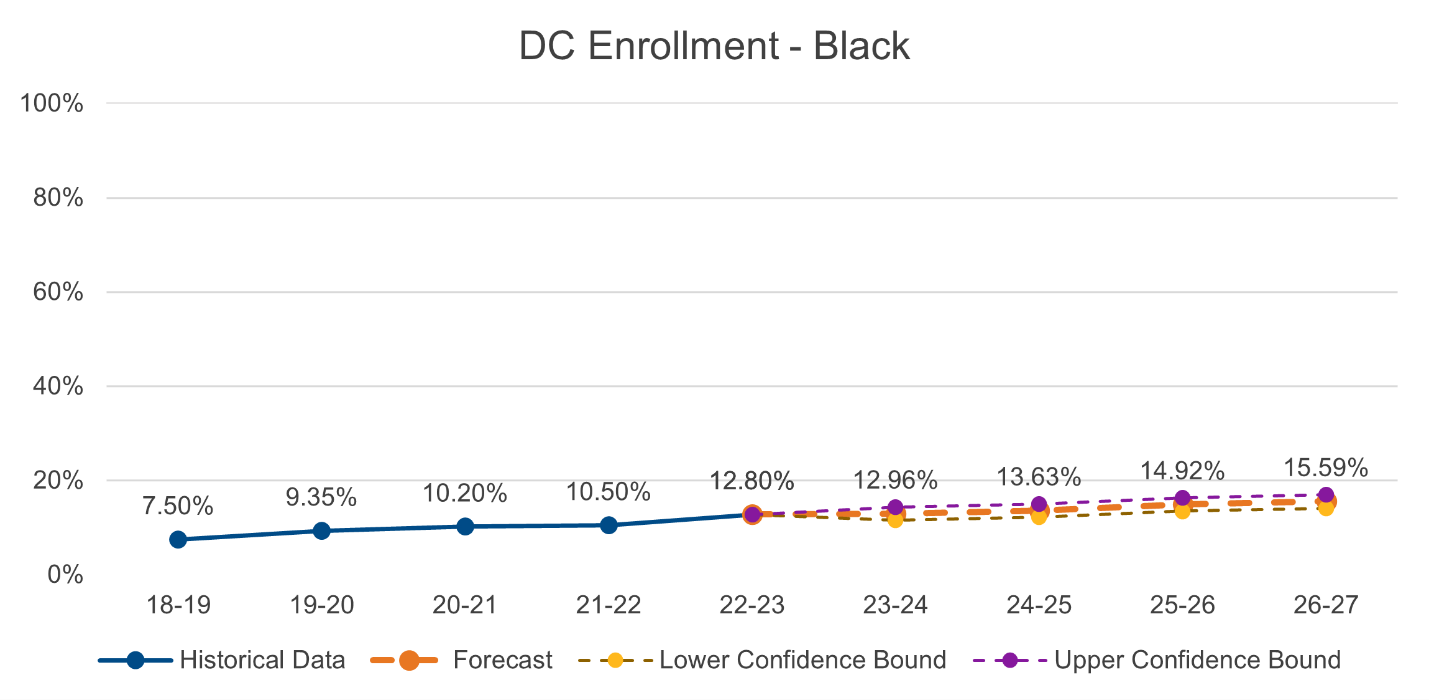
Source: Kentucky Department of Education (KDE) School Report Card
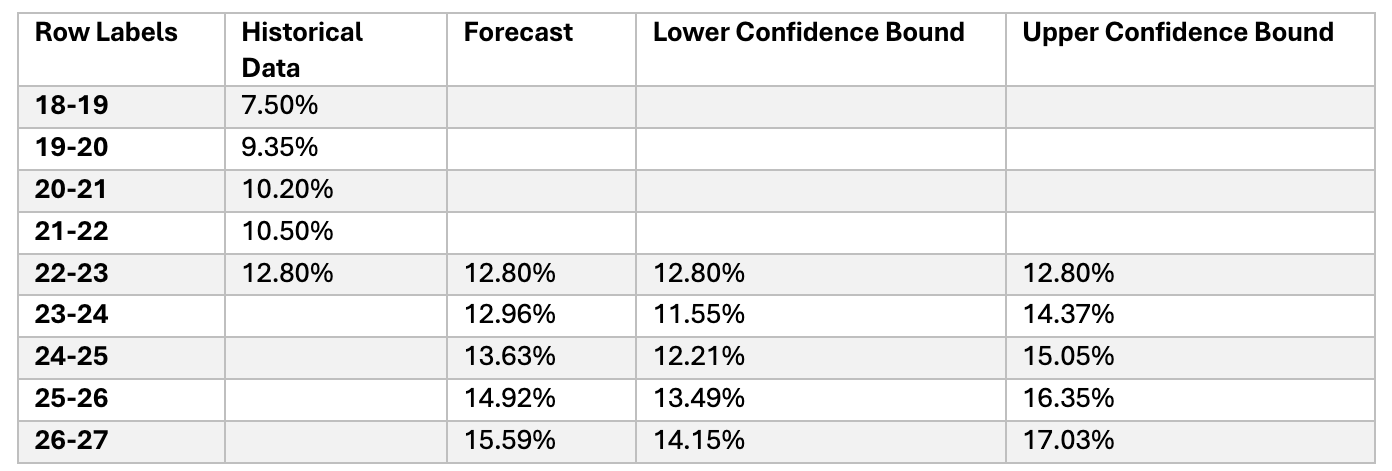
Figure 3.6
Historical Data and Forecast Trend of High School Advanced Coursework Enrollment – Dual Credit (DC) – Latino Students.
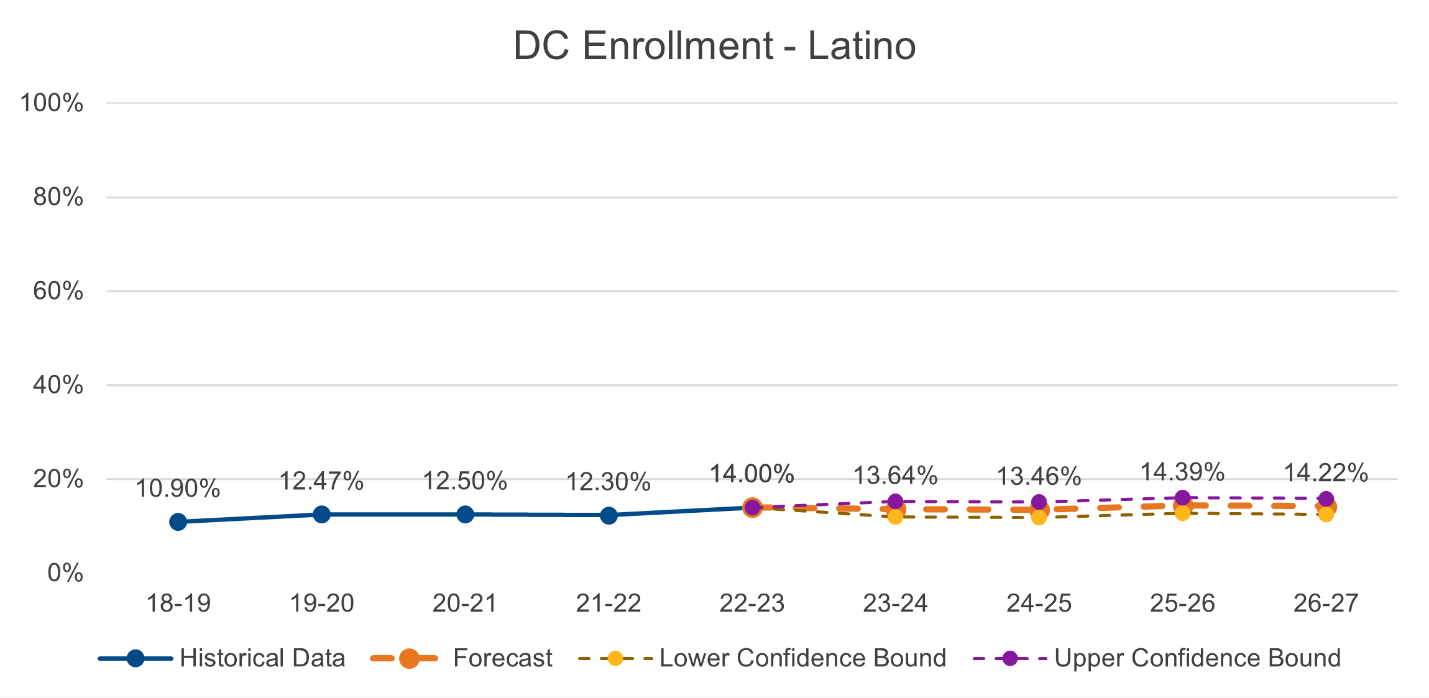
Source: Kentucky Department of Education (KDE) School Report Card
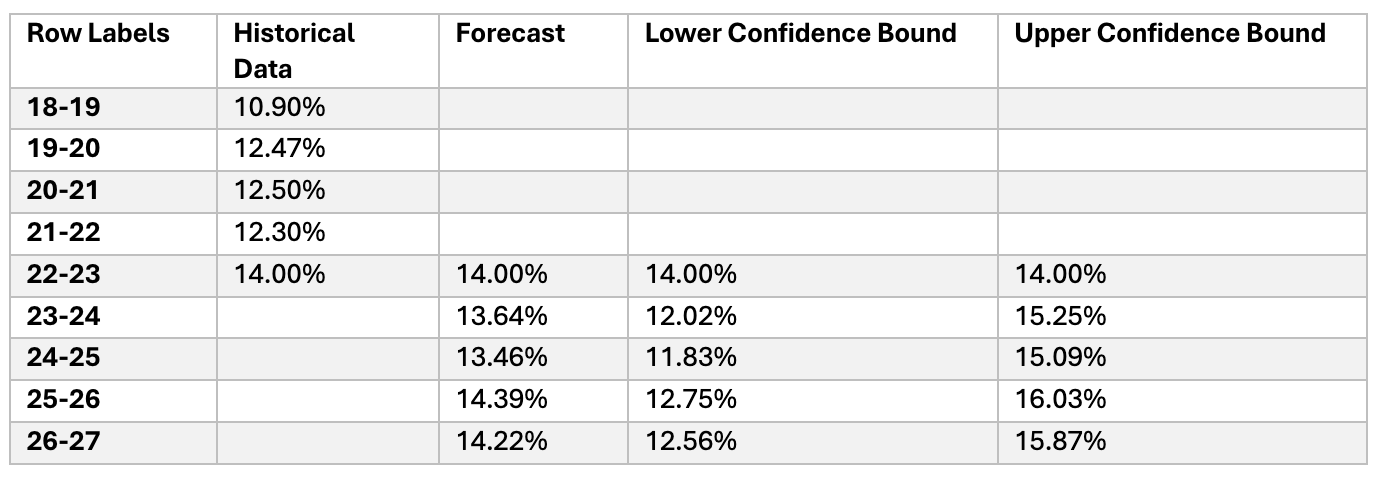
Figure 3.7
Historical Data and Forecast Trend of High School Advanced Coursework Enrollment – Dual Credit (DC) – White Students.
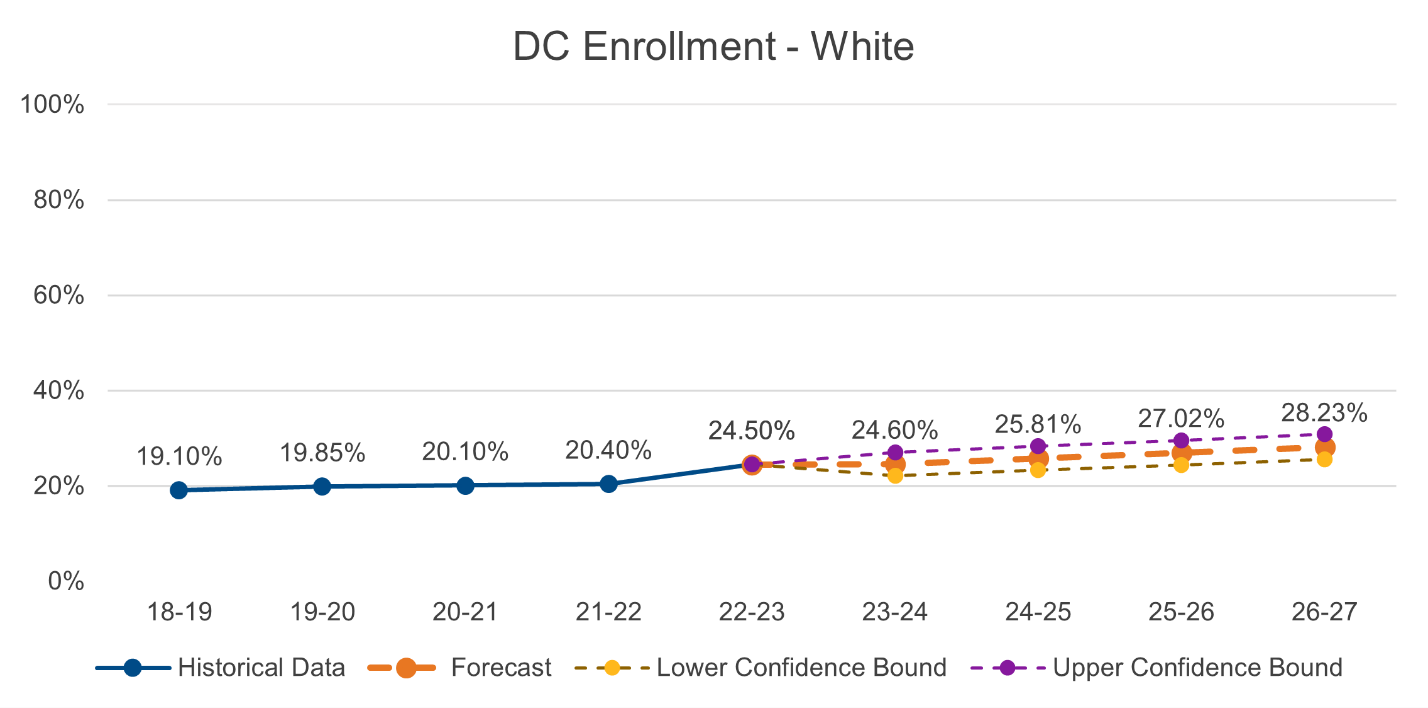
Source: Kentucky Department of Education (KDE) School Report Card
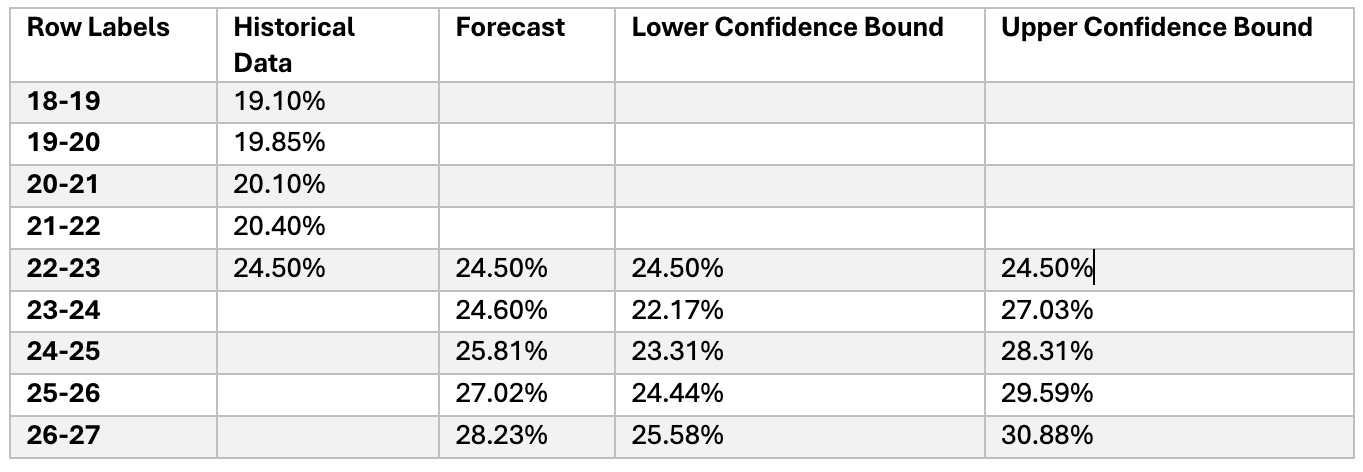
Figure 3.8
Historical Data and Forecast Trend of High School Advanced Coursework Enrollment – Dual Credit (DC) – Multiracial Students.
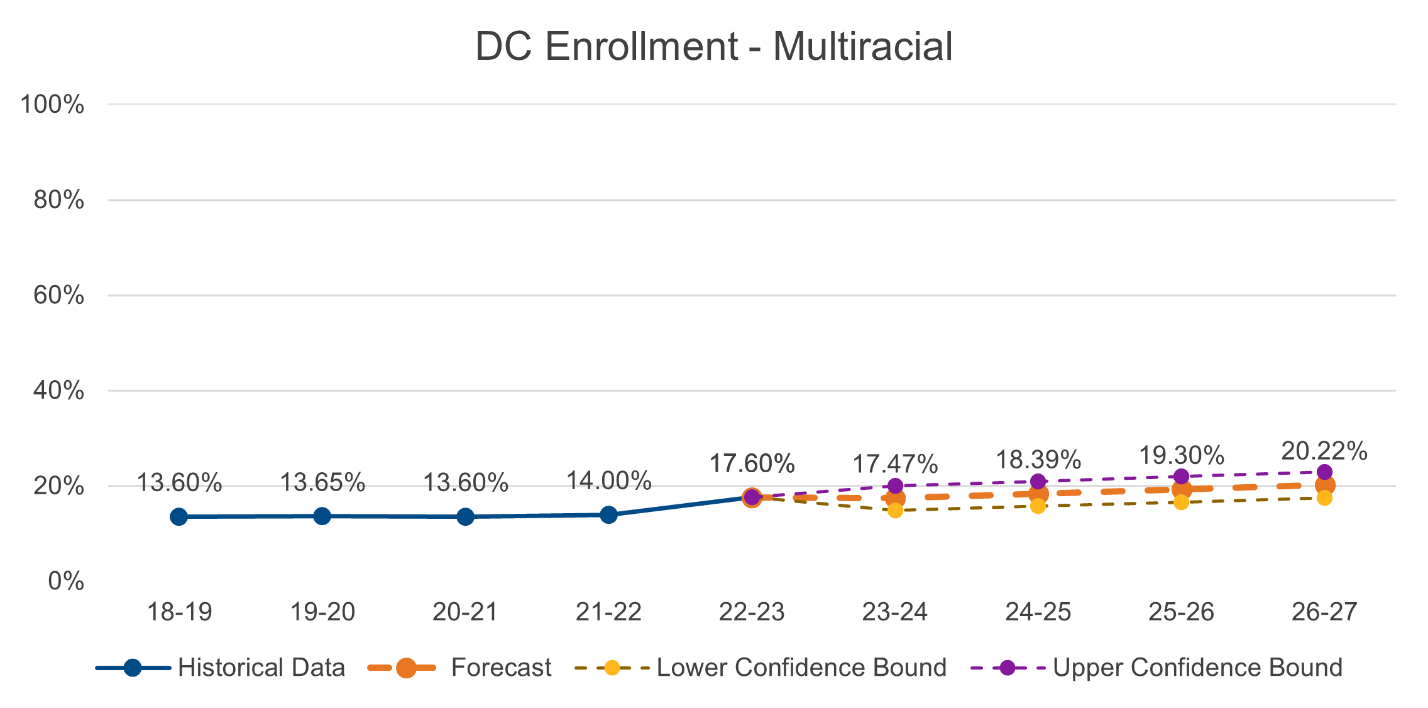
Source: Kentucky Department of Education (KDE) School Report Card
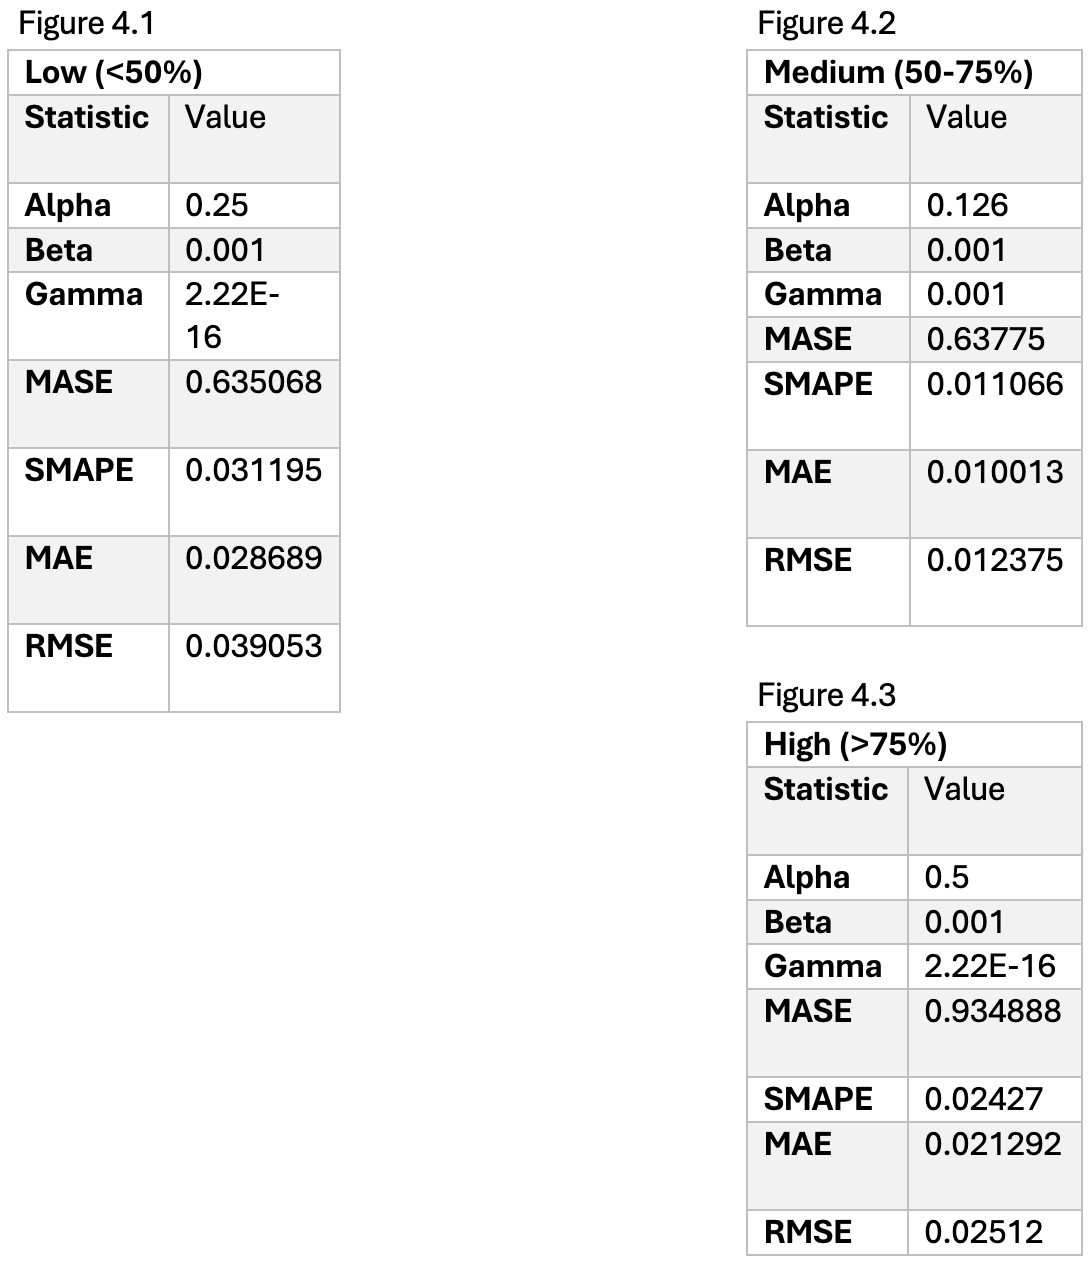
Data Outcome #4: Dual Credit Completion and Students from Low-Income Backgrounds
Figure 4.1
Historical Data and Forecast Trend of High School Dual Credit (DC) Completion – School Districts with 50 Percent or Fewer Economically Disadvantaged Students.
Source: Kentucky Department of Education (KDE) School Report Card
Note: The data value for the year 2019-2020 was estimated using the Excel ‘Forecast Sheet’ function. The method employed is known as ‘interpolation.’ Interpolation is a technique used to predict values within the range of an existing data set. This technique allows for the estimation of data points based on known values.

Figure 4.2
Historical Data and Forecast Trend of High School Dual Credit (DC) Completion – School Districts with between 50 and 75 Percent Economically Disadvantaged Students.
Source: Kentucky Department of Education (KDE) School Report Card
Note: The data value for the year 2019-2020 was estimated using the Excel ‘Forecast Sheet’ function. The method employed is known as ‘interpolation.’ Interpolation is a technique used to predict values within the range of an existing data set. This technique allows for the estimation of data points based on known values.
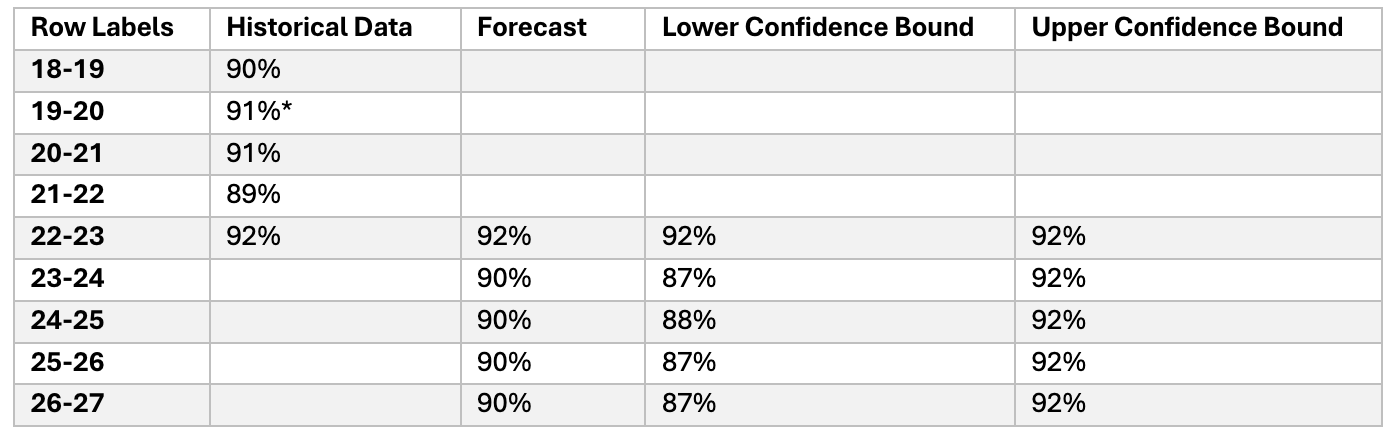
Figure 4.3
Historical Data and Forecast Trend of High School Dual Credit (DC) Completion – School Districts with 75 Percent or More Economically Disadvantaged Students.
Source: Kentucky Department of Education (KDE) School Report Card
Note: The data value for the year 2019-2020 was estimated using the Excel ‘Forecast Sheet’ function. The method employed is known as ‘interpolation.’ Interpolation is a technique used to predict values within the range of an existing data set. This technique allows for the estimation of data points based on known values.
Data Outcome #5: Advanced Placement Drop-Off
Figure 5.1
2022-2023 AP Drop-Off, by Districts with % Students from Low-Income Backgrounds
(Note: This is not a forecast)
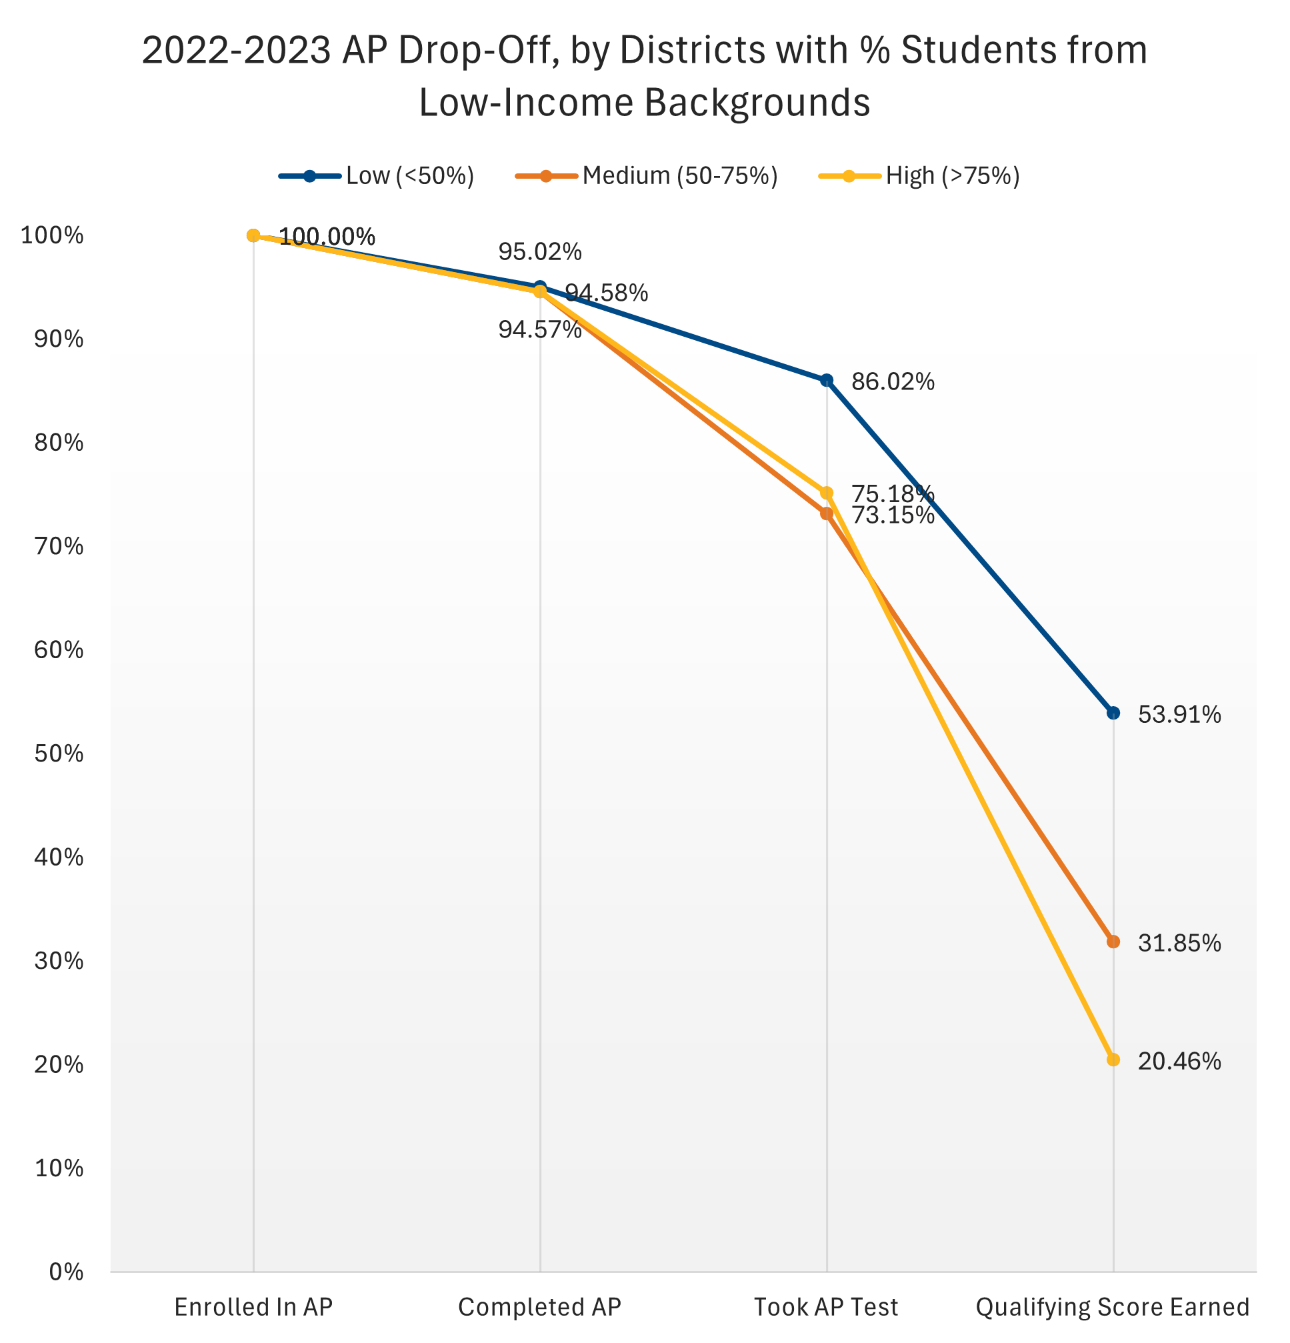
Source: Kentucky Department of Education (KDE) School Report Card
Figure 5.2
2021-2022 AP Drop-Off, by Districts with % Students from Low-Income Backgrounds
(Note: This is not a forecast)
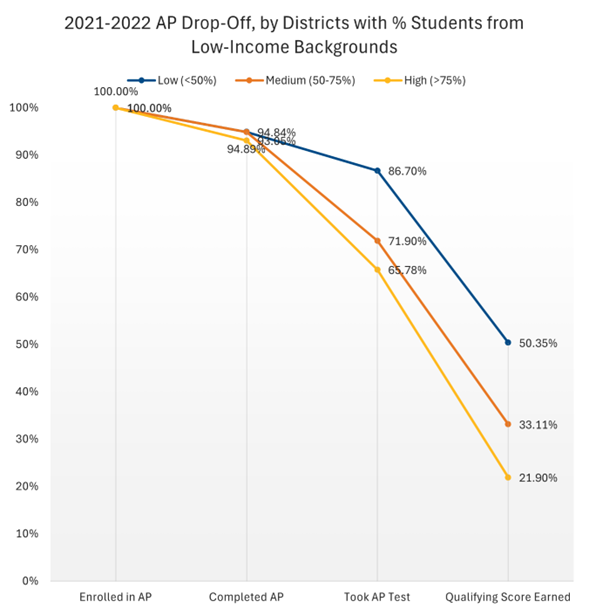
Source: Kentucky Department of Education (KDE) School Report Card
Download: Access to Advance Coursework: Forecast